Technical Analysis of BYSI 2024-05-31
Overview:
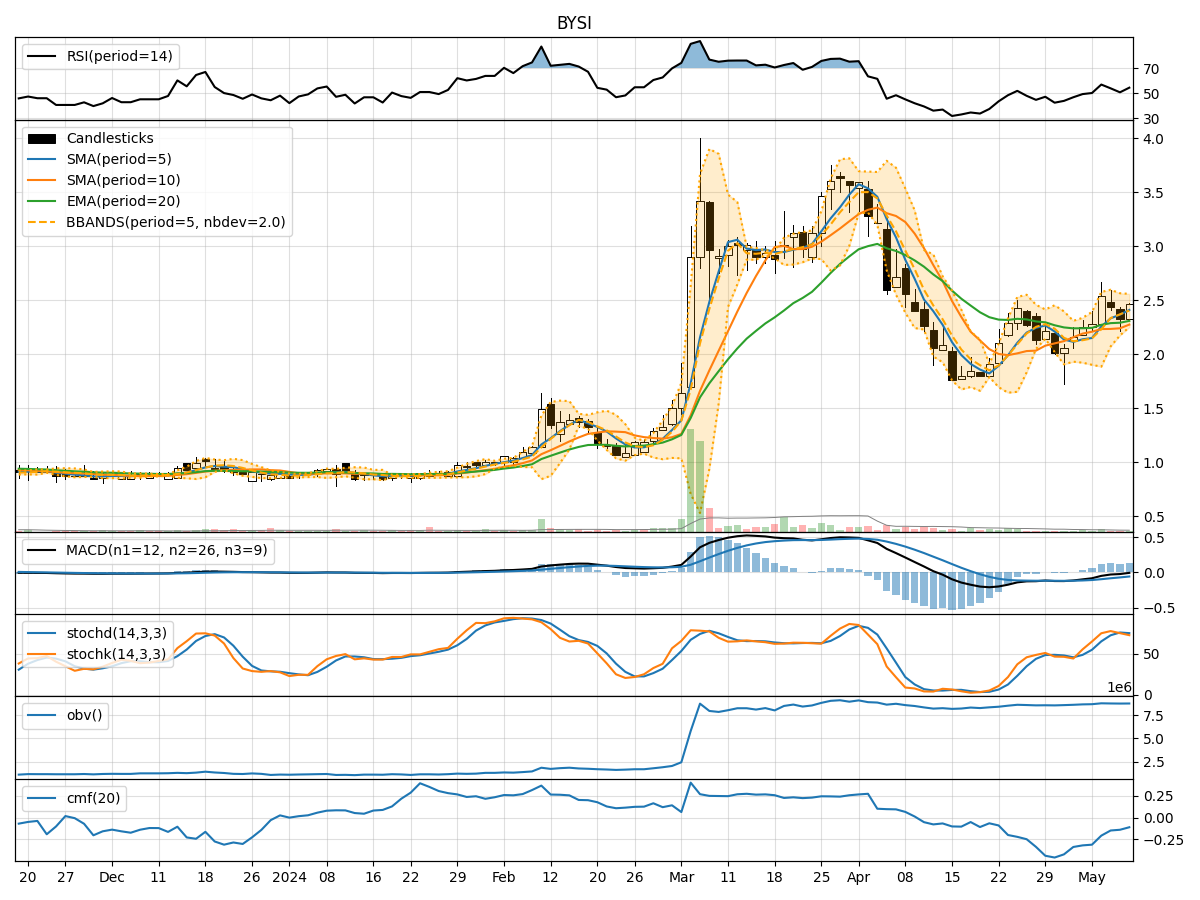
In analyzing the technical indicators for BYSI over the last 5 days, we will delve into the trend, momentum, volatility, and volume indicators to provide a comprehensive outlook on the possible stock price movement in the coming days.
Trend Analysis:
- Moving Averages (MA): The 5-day Moving Average (MA) has been fluctuating around the closing prices, indicating short-term price trends. The Simple Moving Average (SMA) and Exponential Moving Average (EMA) have shown slight increases, suggesting a potential bullish sentiment.
- MACD: The Moving Average Convergence Divergence (MACD) has been positive, with the MACD line consistently above the signal line. This indicates a bullish trend in the stock price.
- Conclusion: The trend indicators suggest a bullish outlook for BYSI in the short term.
Momentum Analysis:
- RSI: The Relative Strength Index (RSI) has been hovering around the mid-range, indicating a neutral momentum in the stock.
- Stochastic Oscillator: Both %K and %D have been declining, suggesting a bearish momentum.
- Williams %R: The Williams %R is in oversold territory, indicating a potential reversal in the momentum.
- Conclusion: The momentum indicators present a mixed outlook, with a slight bearish bias.
Volatility Analysis:
- Bollinger Bands: The Bollinger Bands have been narrowing, indicating decreasing volatility in the stock price.
- Conclusion: The volatility indicators suggest a consolidation phase in BYSI, with the potential for a breakout in either direction.
Volume Analysis:
- On-Balance Volume (OBV): The OBV has been relatively stable, indicating a balance between buying and selling pressure.
- Chaikin Money Flow (CMF): The CMF has been positive but decreasing, suggesting a weakening buying pressure.
- Conclusion: The volume indicators point towards a neutral volume sentiment in the stock.
Overall Conclusion:
Based on the analysis of the technical indicators, the bullish trend signals from the moving averages and MACD are countered by the mixed momentum indicators and consolidation in volatility. The neutral volume sentiment further adds to the uncertainty.
Forecast:
Considering the overall analysis, there is a possibility of sideways movement or a slight bullish bias in the next few days for BYSI. Traders should closely monitor key support and resistance levels for potential breakout opportunities. It is advisable to wait for clearer signals or confirmation from multiple indicators before making significant trading decisions.
Remember, market dynamics can change rapidly, so it's essential to stay updated with real-time data and adjust your strategies accordingly.