Technical Analysis of CABA 2024-05-10
Overview:
In analyzing the technical indicators for CABA stock over the last 5 days, we will delve into the trends, momentum, volatility, and volume aspects to provide a comprehensive outlook on the possible stock price movement. By examining key indicators such as moving averages, MACD, RSI, Bollinger Bands, and OBV, we aim to offer valuable insights and predictions for the upcoming days.
Trend Analysis:
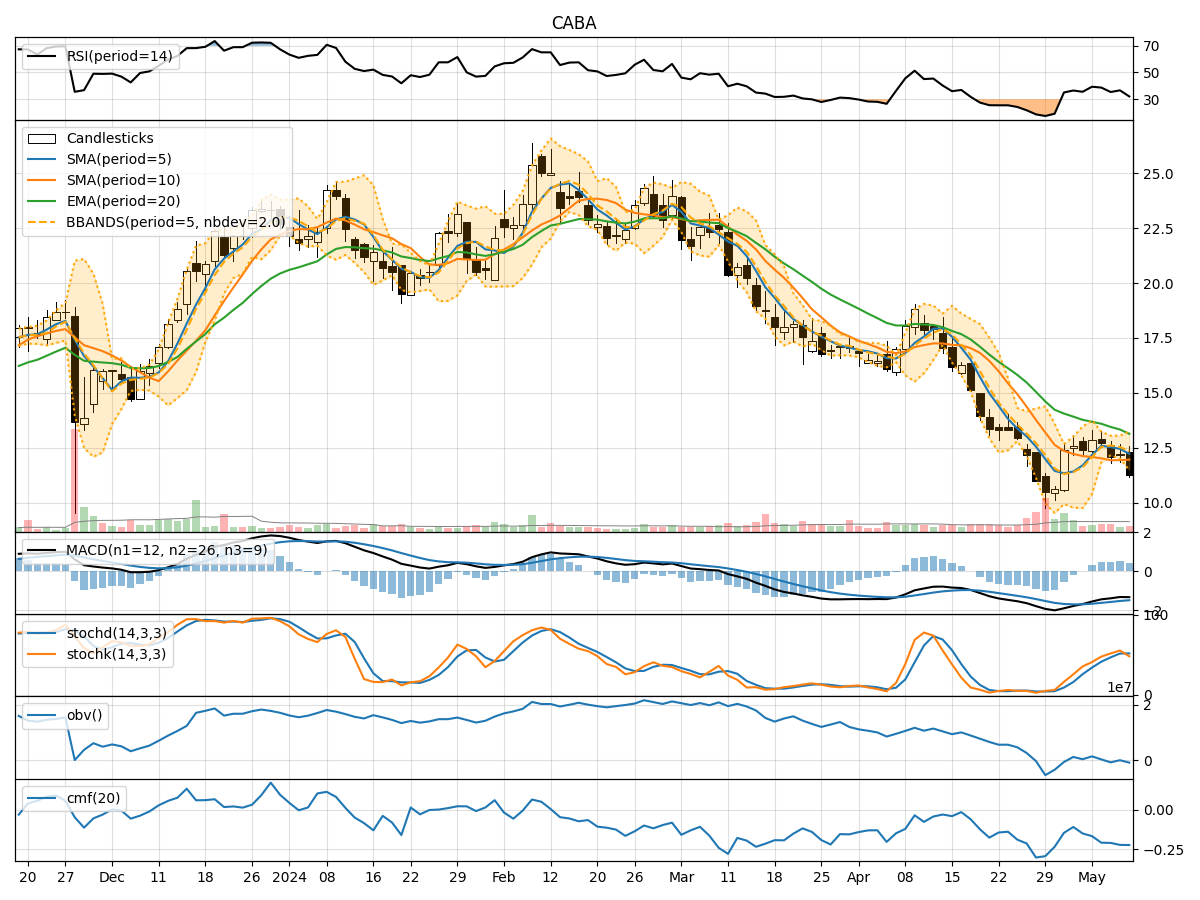
- Moving Averages (MA): The 5-day MA has been fluctuating around the closing prices, indicating short-term price trends. The stock has been below the 10-day SMA, suggesting a bearish sentiment.
- MACD: The MACD line has been consistently below the signal line, indicating a bearish trend in the stock price momentum.
Momentum Analysis:
- RSI: The RSI values have been relatively low, indicating a potential oversold condition in the stock. However, the RSI has not shown a clear trend reversal signal yet.
- Stochastic Oscillator: The Stochastics have been fluctuating but are currently in the overbought zone, suggesting a possible reversal in the stock price.
Volatility Analysis:
- Bollinger Bands (BB): The stock price has been moving within the Bollinger Bands, with the bands narrowing, indicating reduced volatility. A breakout from the bands could signal a new trend.
Volume Analysis:
- On-Balance Volume (OBV): The OBV has been declining, indicating selling pressure in the stock. This negative volume divergence suggests a bearish outlook.
Key Observations:
- The stock is currently in a bearish trend based on moving averages and MACD.
- Momentum indicators like RSI and Stochastics suggest a potential reversal in the oversold region.
- Volatility is decreasing, indicating a possible period of consolidation.
- The OBV shows selling pressure, aligning with the bearish trend.
Conclusion:
Based on the technical analysis of CABA stock, the next few days are likely to see a continuation of the bearish trend with a potential for a short-term reversal indicated by momentum oscillators. The stock may experience consolidation with reduced volatility before a possible breakout. Traders should monitor key levels and wait for confirmation signals before making any significant trading decisions.