Technical Analysis of CALT 2024-05-10
Overview:
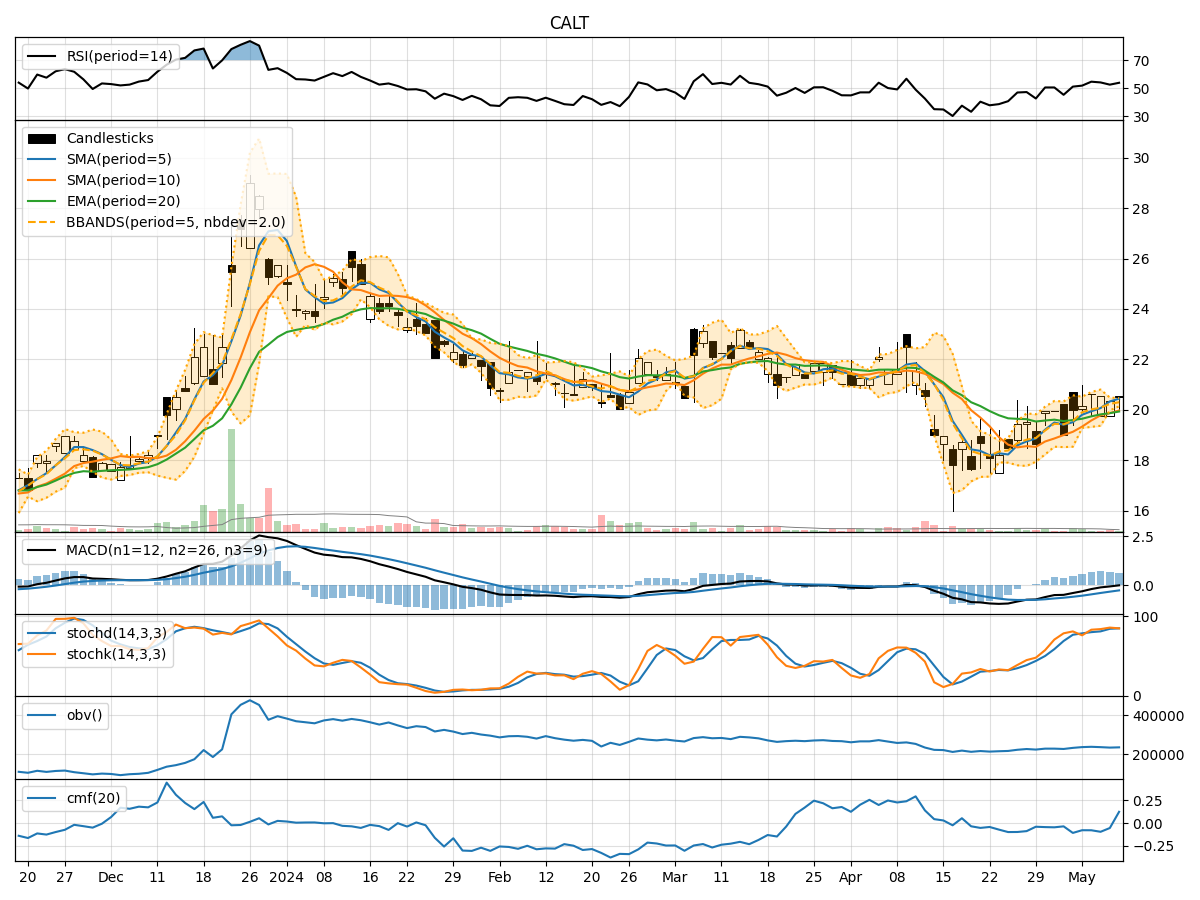
In the last 5 trading days, CALT has shown mixed signals across various technical indicators. The stock price has been fluctuating within a relatively narrow range, indicating indecision in the market. We will analyze the trend, momentum, volatility, and volume indicators to provide insights into the possible future stock price movement of CALT.
Trend Indicators:
- Moving Averages (MA): The 5-day MA has been trending above the closing price, indicating a short-term bullish trend. However, the SMA(10) and EMA(20) are also showing upward trends, suggesting overall positive momentum.
- MACD: The MACD line has been consistently below the signal line, indicating a bearish trend. However, the MACD histogram has been gradually decreasing, signaling a potential reversal in the near future.
Momentum Indicators:
- RSI: The RSI has been fluctuating around the 50 level, indicating a lack of strong momentum in either direction.
- Stochastic Oscillator: Both %K and %D lines of the Stochastic Oscillator are in the overbought zone, suggesting a possible reversal or consolidation.
- Williams %R: The Williams %R is hovering around the oversold territory, indicating a potential buying opportunity.
Volatility Indicators:
- Bollinger Bands: The Bollinger Bands have been narrowing, indicating decreasing volatility. The current price is close to the upper band, suggesting a potential resistance level.
- Bollinger %B: The %B indicator is below 1, indicating that the price is below the upper Bollinger Band, which could signal a potential reversal or consolidation.
Volume Indicators:
- On-Balance Volume (OBV): The OBV has been fluctuating, indicating mixed buying and selling pressure.
- Chaikin Money Flow (CMF): The CMF is negative, suggesting that money is flowing out of the stock. However, the recent uptick in CMF could indicate a potential reversal in buying pressure.
Conclusion:
Based on the analysis of the technical indicators, the next few days for CALT could see sideways movement with a slight bearish bias. The stock is likely to consolidate within the current range, with a potential for a minor pullback before resuming its upward trend. Traders should exercise caution and wait for clearer signals before making significant trading decisions.