Technical Analysis of CBAT 2024-05-10
Overview:
In analyzing the technical indicators for CBAT over the last 5 days, we will delve into the trend, momentum, volatility, and volume indicators to provide a comprehensive outlook on the possible stock price movement. By examining these key indicators, we aim to offer valuable insights and predictions for the upcoming days.
Trend Analysis:
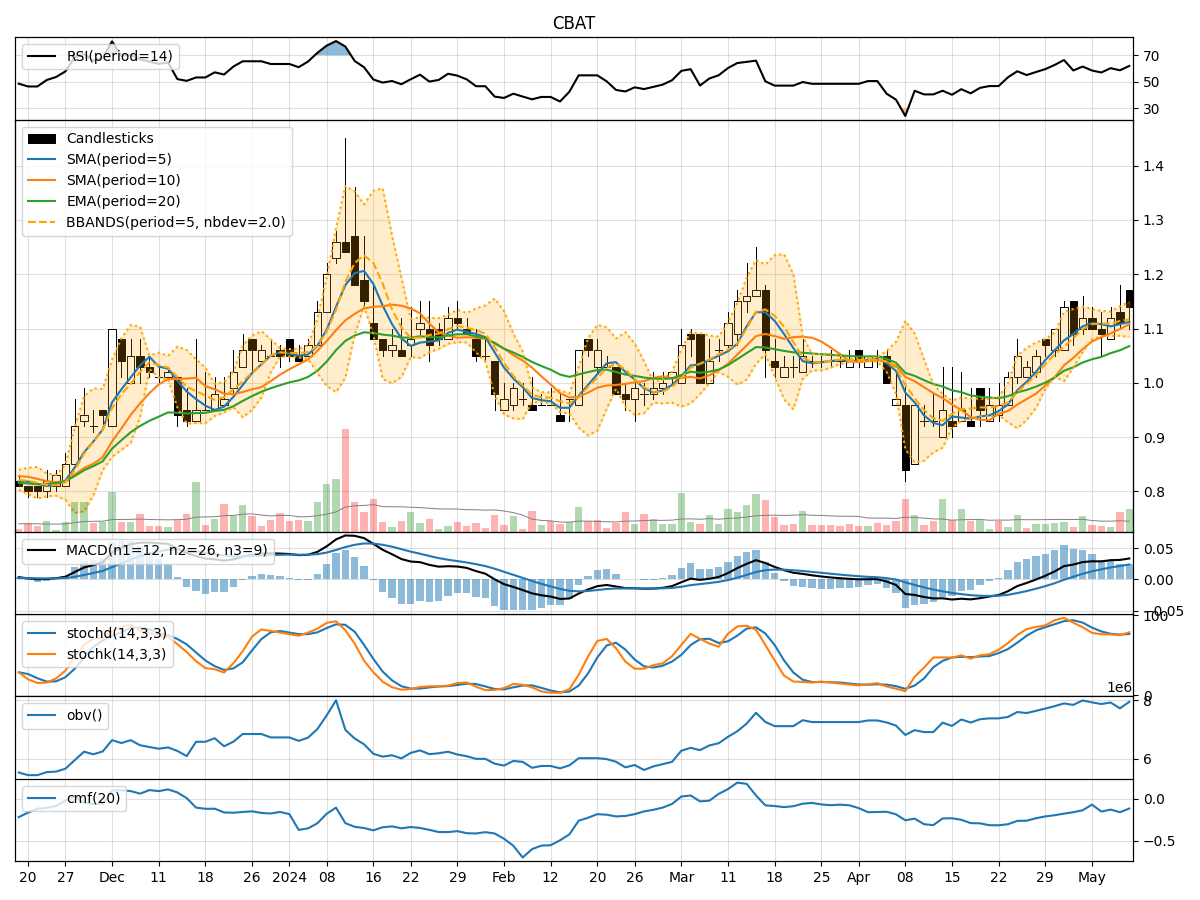
- Moving Averages (MA): The 5-day Moving Average (MA) has been showing an upward trend, indicating a positive momentum in the stock price.
- MACD: The Moving Average Convergence Divergence (MACD) has been consistently increasing, suggesting a strengthening bullish trend.
Momentum Analysis:
- RSI: The Relative Strength Index (RSI) has been fluctuating around the neutral zone, indicating a balanced momentum in the stock.
- Stochastic Oscillator: The Stochastic Oscillator reflects a slightly overbought condition but remains within a reasonable range.
Volatility Analysis:
- Bollinger Bands (BB): The Bollinger Bands show that the stock price has been fluctuating within a defined range, with the bands narrowing in recent days.
Volume Analysis:
- On-Balance Volume (OBV): The OBV indicator has been relatively stable, suggesting a neutral sentiment in terms of volume accumulation.
- Chaikin Money Flow (CMF): The CMF indicates a slight negative flow of money over the past 20 days.
Key Observations:
- The trend indicators suggest a bullish sentiment with the moving averages and MACD pointing towards an upward trajectory.
- Momentum indicators show a neutral momentum with RSI and Stochastic Oscillator not indicating any extreme overbought or oversold conditions.
- Volatility indicators imply a consolidation phase with the Bollinger Bands narrowing, signaling a potential breakout.
- Volume indicators reflect a balanced volume accumulation with OBV and CMF indicating a neutral sentiment.
Conclusion:
Based on the analysis of the technical indicators, the next few days for CBAT are likely to see continued upward movement in the stock price. The bullish trend indicated by the moving averages and MACD, coupled with the consolidation phase suggested by the narrowing Bollinger Bands, point towards a potential breakout to the upside. While momentum and volume indicators remain neutral, the overall technical outlook leans towards a bullish bias for CBAT in the upcoming days. Investors may consider buying opportunities in anticipation of a potential price surge.