Technical Analysis of CBSH 2024-05-10
Overview:
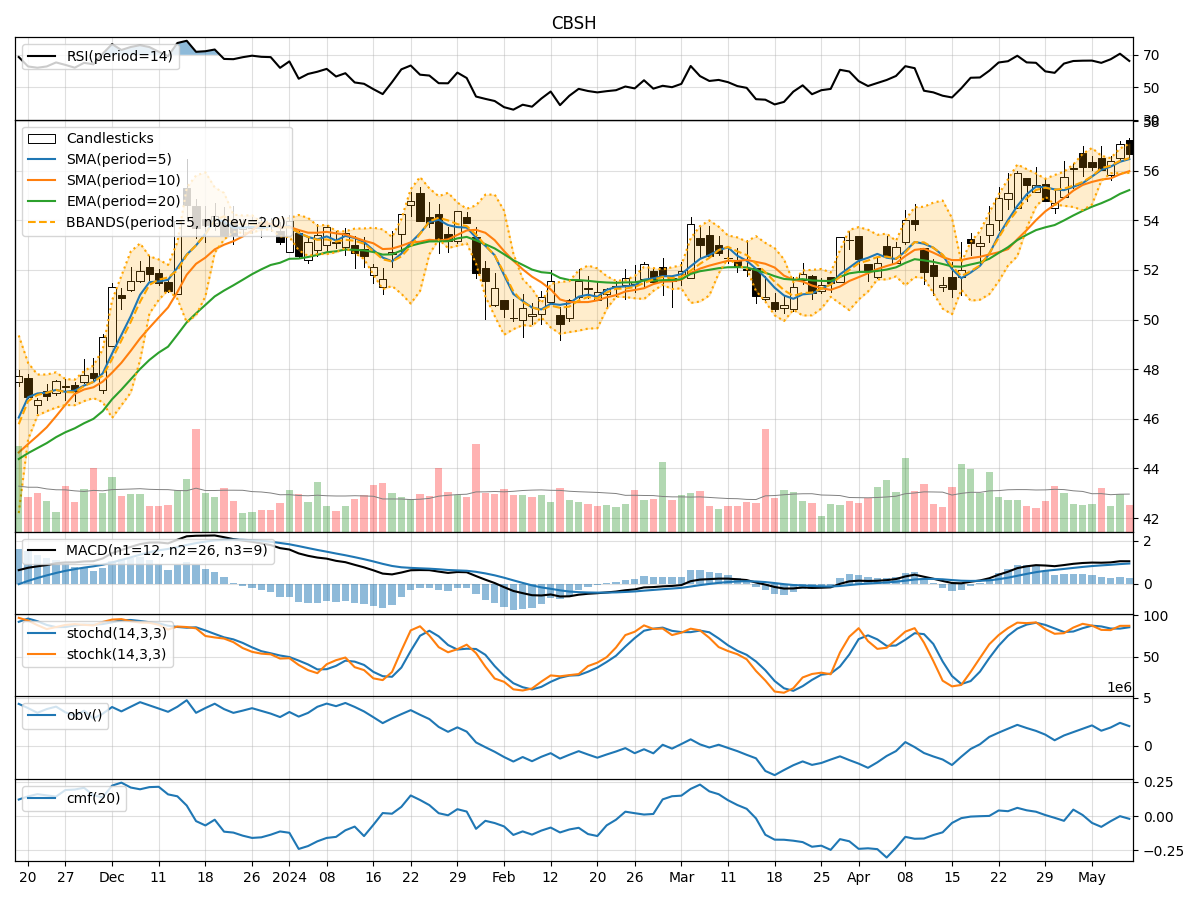
In the last 5 trading days, CBSH stock has shown mixed signals across various technical indicators. The trend indicators suggest a slightly bullish sentiment, with the moving averages trending upwards. Momentum indicators indicate a neutral to slightly bullish momentum, while volatility indicators show fluctuating but relatively stable price movements. Volume indicators reflect a slight decrease in buying pressure.
Trend Analysis:
- Moving Averages (MA): The 5-day MA is consistently above the 10-day SMA, indicating a short-term bullish trend. The EMA(20) is also trending upwards, supporting a bullish sentiment.
- MACD: The MACD line is above the signal line, indicating a bullish trend. The MACD histogram is positive, suggesting upward momentum.
Momentum Analysis:
- RSI: The RSI is above 50, indicating bullish momentum. However, it is not in overbought territory, suggesting room for further upside.
- Stochastic Oscillator: Both %K and %D lines are in the overbought zone, indicating a potential reversal. The Williams %R is in oversold territory, suggesting a possible buying opportunity.
Volatility Analysis:
- Bollinger Bands (BB): The price is currently trading within the bands, indicating normal volatility. The bands are relatively stable, suggesting a lack of significant price fluctuations.
- Bollinger %B: The %B is hovering around 0.5, indicating a balanced market sentiment.
Volume Analysis:
- On-Balance Volume (OBV): The OBV has shown a slight decrease, suggesting a decrease in buying pressure. This could indicate weakening bullish momentum.
- Chaikin Money Flow (CMF): The CMF is negative, indicating a slight outflow of money from the stock. This aligns with the decrease in OBV.
Conclusion:
Based on the analysis of the technical indicators, the next few days for CBSH stock are likely to see sideways consolidation with a slight bearish bias. While the trend indicators suggest a bullish sentiment, the momentum indicators show signs of potential reversal from overbought levels. The decrease in buying pressure indicated by volume indicators further supports a cautious outlook.
Key Points: - Trend: Slightly bullish - Momentum: Neutral to slightly bullish, potential reversal - Volatility: Stable with normal fluctuations - Volume: Decrease in buying pressure
Overall Recommendation: Considering the mixed signals from the technical indicators, it is advisable to exercise caution in trading CBSH stock in the next few days. Traders may consider taking profits on existing positions or waiting for clearer signals before entering new positions.