Technical Analysis of CCG 2024-05-10
Overview:
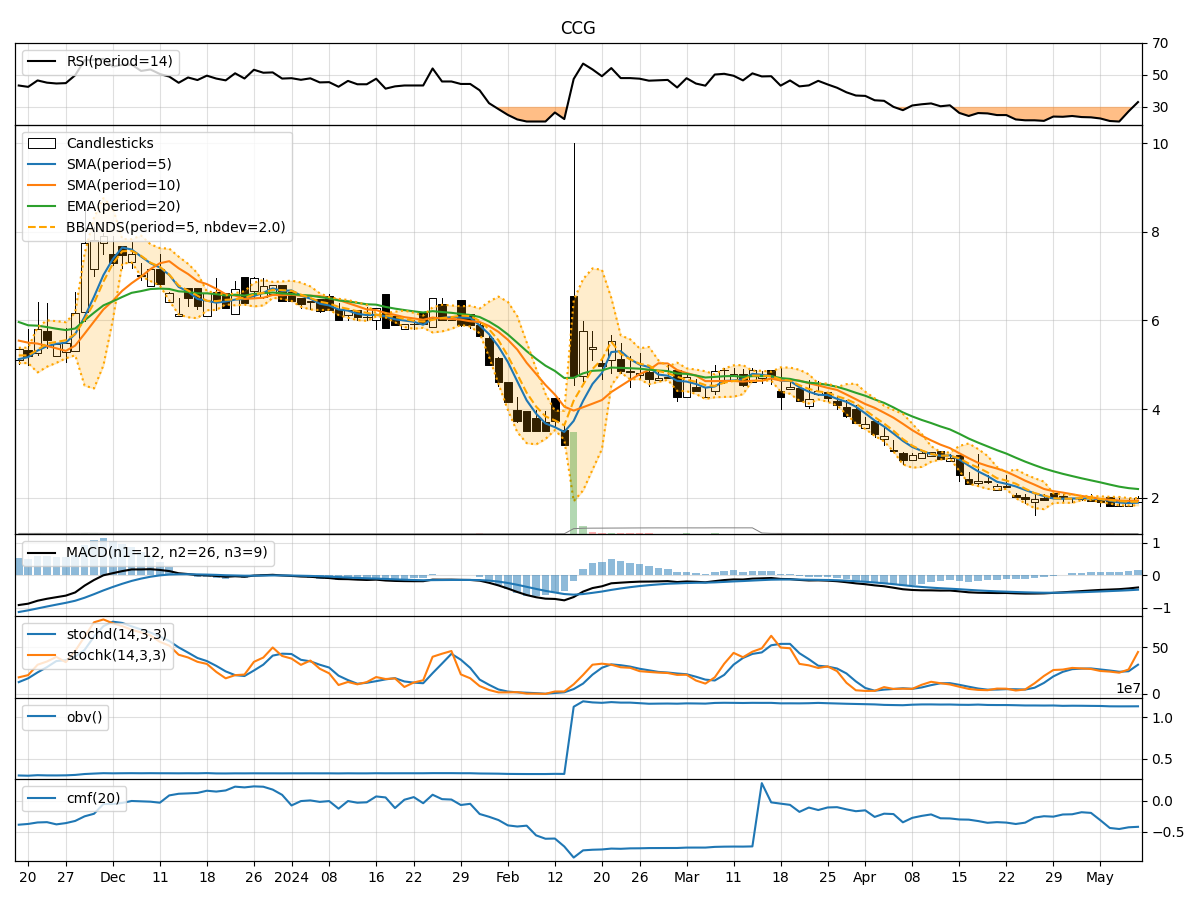
In analyzing the technical indicators for CCG over the last 5 days, we will delve into the trend, momentum, volatility, and volume indicators to provide a comprehensive outlook on the possible stock price movement in the coming days. By examining key metrics such as moving averages, MACD, RSI, Bollinger Bands, and OBV, we aim to offer a detailed and insightful analysis to guide your investment decisions.
Trend Indicators:
- Moving Averages (MA): The 5-day MA has been consistently below the closing prices, indicating a short-term downtrend.
- MACD: The MACD line has been negative, suggesting bearish momentum in the stock.
- EMA: The EMA values have been declining, reflecting a weakening trend.
Key Observation: The trend indicators point towards a downward trajectory for CCG in the short term.
Momentum Indicators:
- RSI: The RSI values have been relatively low, indicating oversold conditions.
- Stochastic Oscillator: Both %K and %D values have been trending lower, signaling weakening momentum.
- Williams %R: The indicator has been in the oversold territory, suggesting a potential reversal.
Key Observation: Momentum indicators suggest a bearish sentiment in the stock.
Volatility Indicators:
- Bollinger Bands: The stock price has been trading below the lower Bollinger Band, indicating oversold conditions.
- Bollinger %B: The %B value has been below 0.2, signaling potential undervaluation.
- Bollinger Band Width: The band width has widened, reflecting increased volatility.
Key Observation: Volatility indicators imply a high level of volatility in the stock.
Volume Indicators:
- On-Balance Volume (OBV): The OBV values have been relatively stable, suggesting a balance between buying and selling pressure.
- Chaikin Money Flow (CMF): The CMF values have been negative, indicating outflow of money from the stock.
Key Observation: Volume indicators indicate a neutral stance in terms of buying and selling pressure.
Conclusion:
Based on the analysis of trend, momentum, volatility, and volume indicators, the overall outlook for CCG in the next few days appears to be bearish. The stock is likely to continue its downward trend with increased volatility, supported by the negative momentum signals and oversold conditions. Traders should exercise caution and consider short-term selling opportunities or wait for a potential reversal confirmation before considering long positions.
Key Takeaways:
- Direction: Downward
- Momentum: Bearish
- Volatility: High
- Volume: Neutral
In conclusion, it is advisable to closely monitor the stock's price action and key technical levels for potential entry or exit points, considering the prevailing market dynamics and risk factors associated with CCG.