Technical Analysis of CCTG 2024-05-10
Overview:
In analyzing the technical indicators for CCTG over the last 5 days, we will delve into the trend, momentum, volatility, and volume indicators to provide a comprehensive outlook on the possible stock price movement in the coming days. By examining these key aspects, we aim to offer valuable insights and recommendations for potential investors.
Trend Analysis:
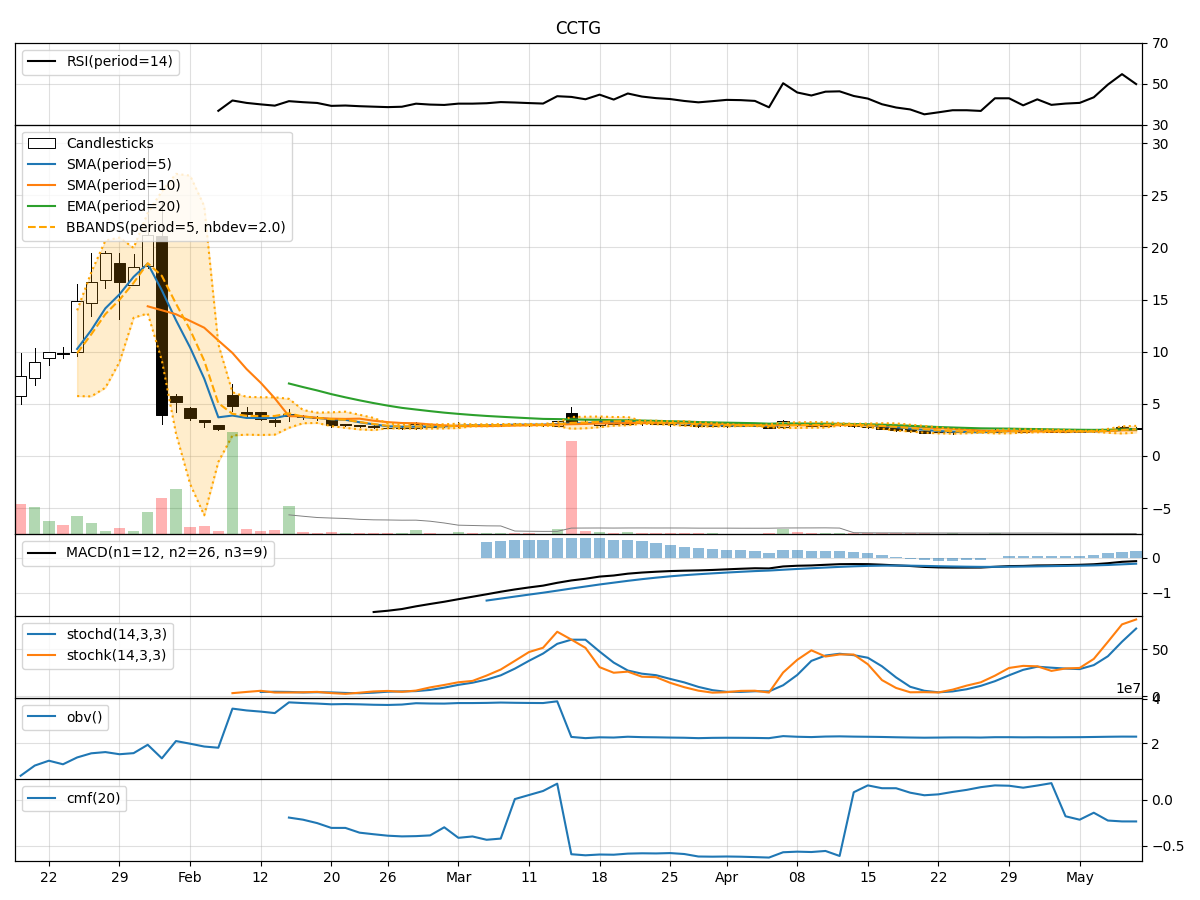
- Moving Averages (MA): The 5-day MA has been fluctuating around the closing prices, indicating short-term price trends. The SMA(10) and EMA(20) show a slight divergence, suggesting potential changes in the trend.
- MACD: The MACD line has been consistently below the signal line, indicating a bearish trend. However, the MACD histogram has shown some recent upticks, hinting at a possible reversal.
Momentum Analysis:
- RSI: The RSI has been oscillating around the 50 level, indicating a neutral momentum in the stock. There is no clear overbought or oversold signal.
- Stochastic Oscillator: Both %K and %D have been in the overbought territory, suggesting a potential reversal or consolidation in the stock price.
- Williams %R: The Williams %R has been in the oversold region, indicating a bearish sentiment in the market.
Volatility Analysis:
- Bollinger Bands (BB): The stock price has been trading within the bands, with recent volatility narrowing. This could signal a period of consolidation or a potential breakout in the near future.
Volume Analysis:
- On-Balance Volume (OBV): The OBV has been relatively flat, indicating a balance between buying and selling pressure. This could suggest indecision among market participants.
- Chaikin Money Flow (CMF): The CMF has been negative, indicating outflows from the stock. This could be a bearish signal for the stock price.
Key Observations:
- The stock is currently exhibiting mixed signals across different indicators, with no clear trend direction.
- The momentum indicators suggest a lack of strong buying or selling pressure in the market.
- Volatility has been decreasing, indicating a potential period of consolidation.
- Volume indicators show a lack of significant accumulation or distribution in the stock.
Conclusion:
Based on the analysis of the technical indicators, the next few days for CCTG could see sideways movement or consolidation. The lack of clear trends in the trend and momentum indicators, coupled with decreasing volatility and neutral volume signals, suggests a period of indecision in the market. Investors may want to exercise caution and wait for clearer signals before making any significant trading decisions.