Technical Analysis of CEAD 2024-05-31
Overview:
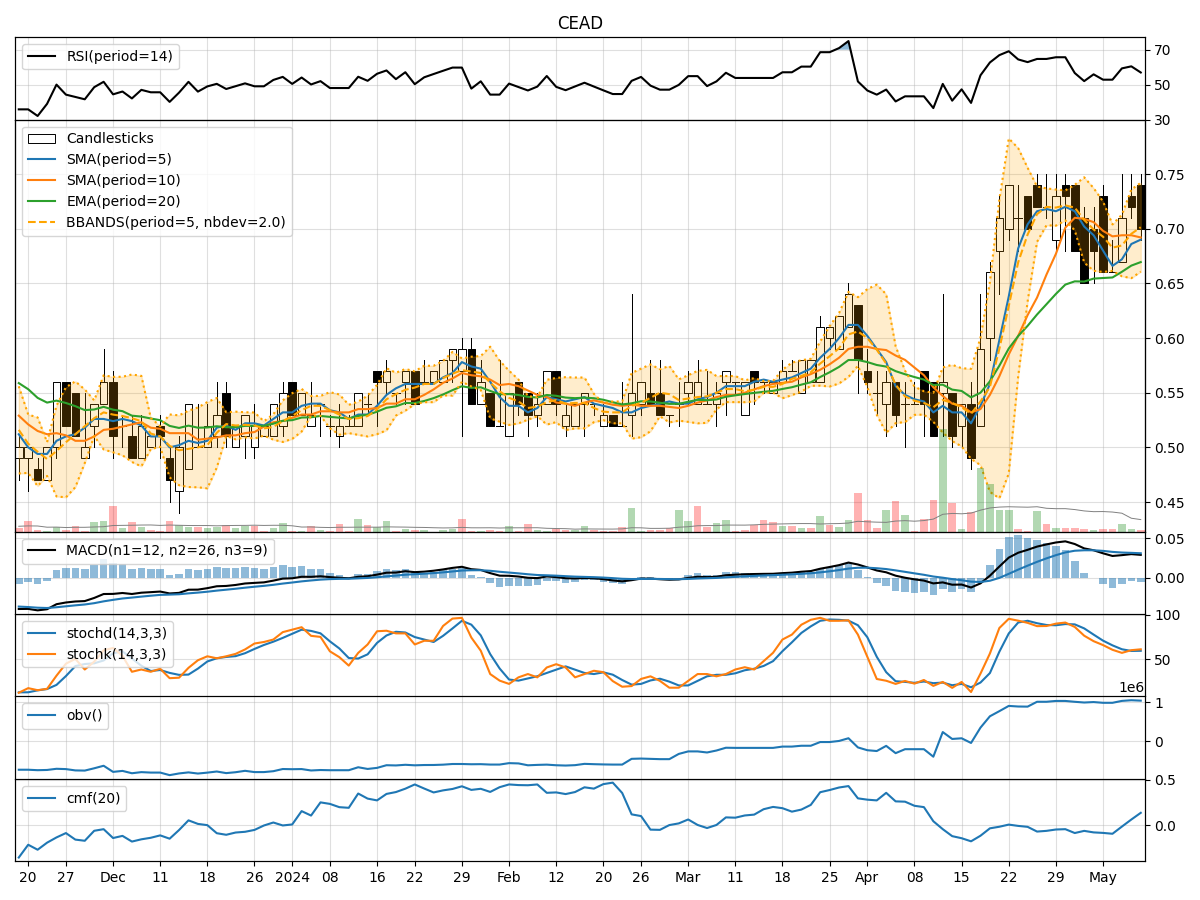
In analyzing the technical indicators for CEAD over the last 5 days, we will delve into the trend, momentum, volatility, and volume indicators to provide a comprehensive assessment of the stock's potential price movement. By examining these key factors, we aim to offer valuable insights and predictions for the next few days.
Trend Analysis:
- Moving Averages (MA): The 5-day MA has been consistently decreasing, indicating a downward trend in the stock price.
- MACD: The MACD line has been positive but decreasing, while the MACD Histogram has been consistently negative, suggesting a weakening bullish momentum.
Momentum Analysis:
- RSI: The RSI has been declining, indicating a loss of bullish strength in the stock.
- Stochastic Oscillator: Both %K and %D have been decreasing, signaling a bearish momentum.
- Williams %R: The indicator has been in oversold territory, suggesting a potential reversal or continuation of the downtrend.
Volatility Analysis:
- Bollinger Bands (BB): The stock price has been trading below the lower Bollinger Band, indicating oversold conditions and potential for a reversal.
- Bollinger %B: The %B value has been decreasing, reflecting the downward price movement.
Volume Analysis:
- On-Balance Volume (OBV): The OBV has been relatively flat, indicating a balance between buying and selling pressure.
- Chaikin Money Flow (CMF): The CMF has been negative, suggesting outflow of money from the stock.
Key Observations:
- The stock is currently in a downtrend based on moving averages and MACD analysis.
- Momentum indicators such as RSI and Stochastic Oscillator point towards bearish sentiment.
- Volatility indicators suggest the stock is oversold but still under downward pressure.
- Volume indicators show a lack of significant buying interest in the stock.
Conclusion:
Based on the technical analysis of trend, momentum, volatility, and volume indicators, the next few days' possible stock price movement for CEAD is likely to be downward. The stock shows signs of weakness, with indicators pointing towards a continuation of the current downtrend. Traders and investors should exercise caution and consider waiting for more positive signals before considering long positions.