Technical Analysis of CFFN 2024-05-10
Overview:
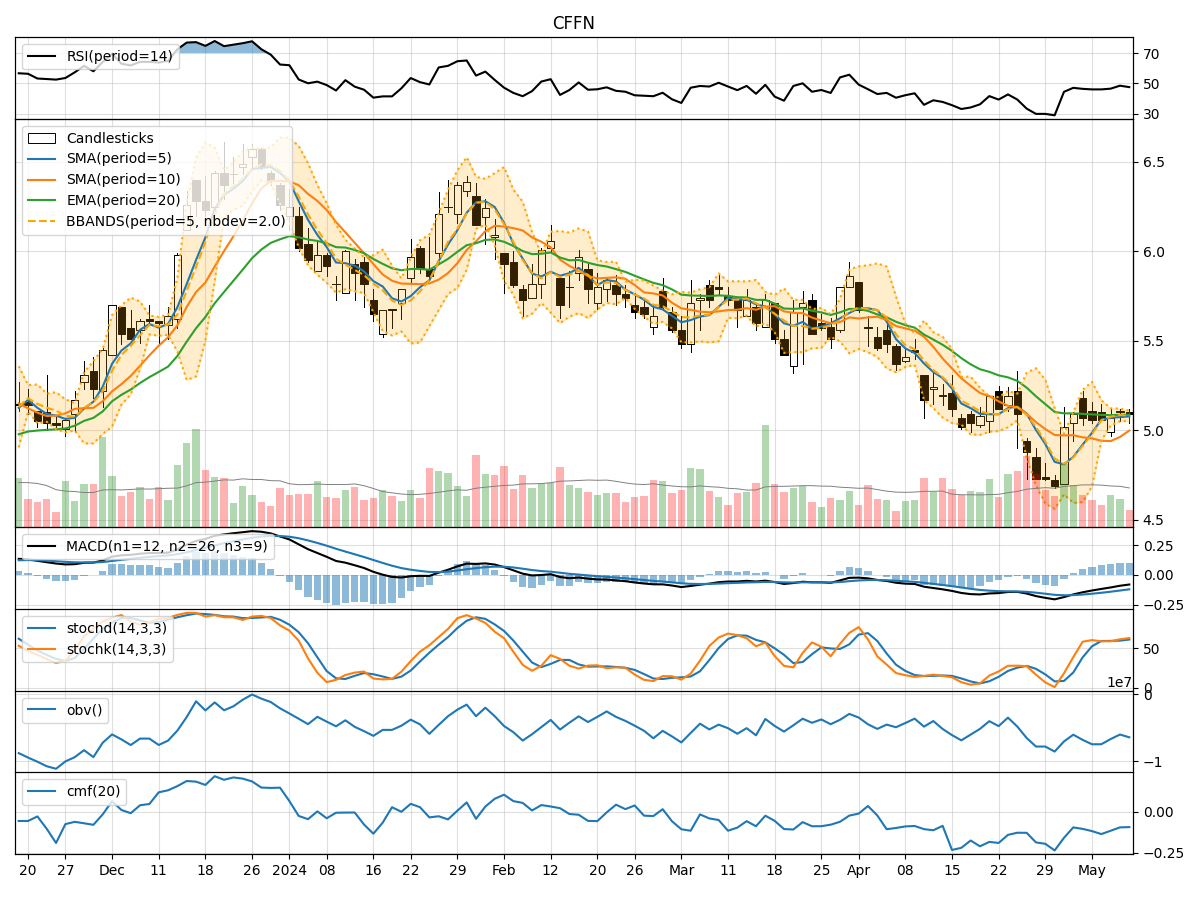
In analyzing the technical indicators for CFFN over the last 5 days, we will delve into the trend, momentum, volatility, and volume indicators to provide a comprehensive outlook on the possible stock price movement. By examining these key factors, we aim to offer valuable insights and predictions for the upcoming days.
Trend Analysis:
- Moving Averages (MA): The 5-day Moving Average (MA) has been steadily increasing, indicating a short-term uptrend in the stock price.
- MACD: The Moving Average Convergence Divergence (MACD) has been positive, suggesting bullish momentum in the stock.
- EMA: The Exponential Moving Average (EMA) has been relatively stable, reflecting a consistent trend in the stock price.
Key Observation: The trend indicators point towards a bullish sentiment in the stock price movement.
Momentum Analysis:
- RSI: The Relative Strength Index (RSI) has been fluctuating around the neutral zone, indicating a balanced momentum in the stock.
- Stochastic Oscillator: Both %K and %D have shown upward movements, suggesting increasing buying pressure.
- Williams %R: The Williams %R is in the oversold region, indicating a potential reversal in the stock price.
Key Observation: The momentum indicators suggest a mixed sentiment with a slight bullish bias.
Volatility Analysis:
- Bollinger Bands: The Bollinger Bands have shown narrowing, indicating decreasing volatility in the stock price.
- Bollinger %B: The %B indicator is hovering around the midline, reflecting a balanced volatility level.
Key Observation: Volatility indicators signal a consolidation phase in the stock price.
Volume Analysis:
- On-Balance Volume (OBV): The OBV has shown mixed movements, reflecting indecision among investors.
- Chaikin Money Flow (CMF): The CMF has been negative, indicating a slight outflow of money from the stock.
Key Observation: Volume indicators suggest a neutral stance with a slight bearish inclination.
Conclusion:
Based on the analysis of trend, momentum, volatility, and volume indicators, the overall outlook for CFFN in the next few days leans towards a bullish sentiment. The trend indicators support a positive price movement, while momentum indicators show a mixed but slightly bullish bias. Volatility signals a consolidation phase, and volume indicators indicate a neutral to slightly bearish stance.
Recommendation:
Considering the collective analysis of technical indicators, it is likely that CFFN will experience upward price movement in the next few days. Traders may consider initiating long positions with appropriate risk management strategies in place to capitalize on potential gains.