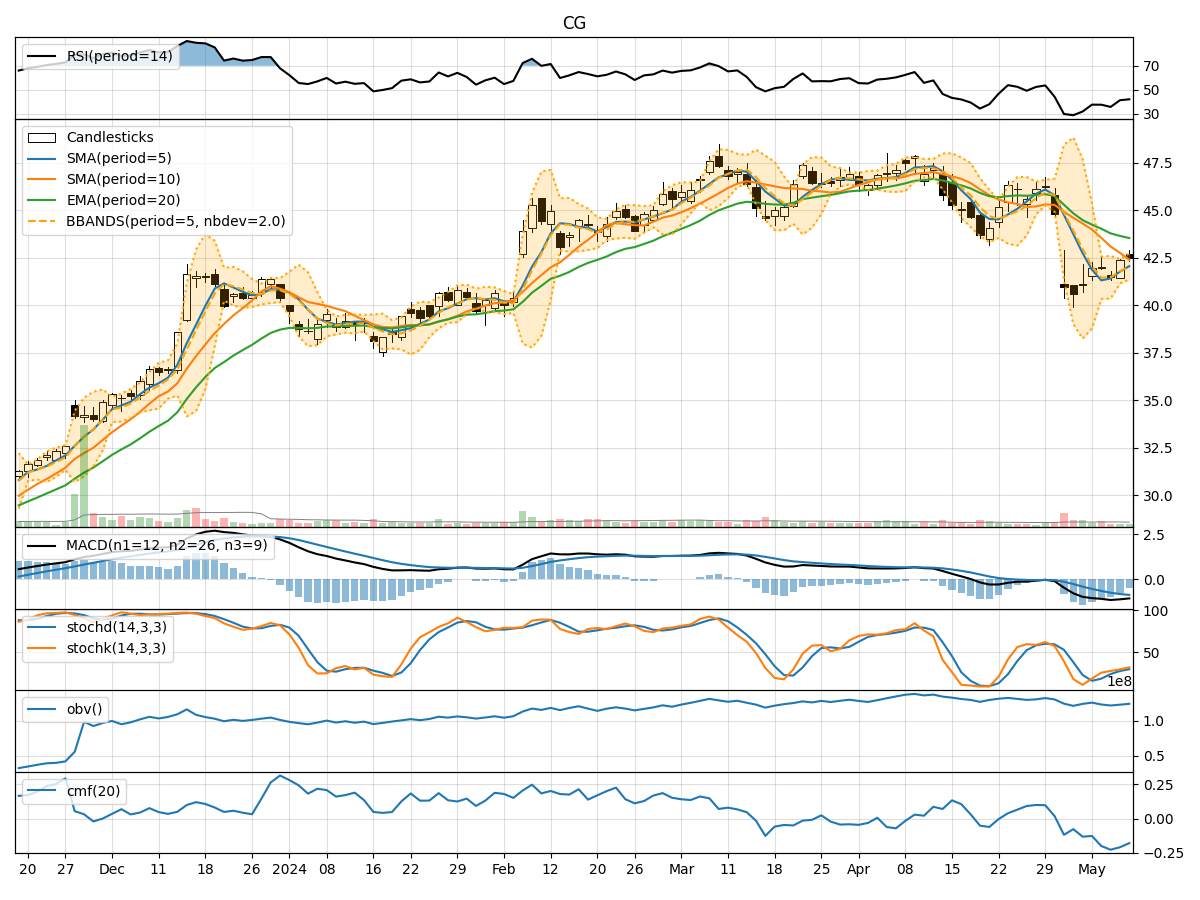
Technical Analysis of CG 2024-05-10
Overview:
In analyzing the technical indicators for CG stock over the last 5 days, we will delve into the trend, momentum, volatility, and volume indicators to provide a comprehensive assessment of the stock's potential price movement. By examining these key factors, we aim to offer valuable insights and predictions for the next few days.
Trend Analysis:
- Moving Averages (MA): The 5-day MA has been fluctuating around the closing prices, indicating short-term price trends. The SMA(10) and EMA(20) show a downward trend, suggesting a bearish sentiment in the medium to long term.
- MACD: The MACD line has been consistently below the signal line, indicating a bearish trend in momentum.
- MACD Histogram: The negative values of the MACD Histogram further confirm the bearish momentum in the stock.
Momentum Analysis:
- RSI: The RSI values have been relatively low, indicating oversold conditions in the stock.
- Stochastic Oscillator: Both %K and %D values have been increasing, but they are still in the oversold territory.
- Williams %R: The Williams %R values are also in the oversold region, suggesting a potential reversal in the stock's price.
Volatility Analysis:
- Bollinger Bands (BB): The stock price has been trading within the lower Bollinger Band, indicating a potential oversold condition.
- Bollinger %B: The %B value has been increasing, suggesting a possible reversal in the stock's price trend.
Volume Analysis:
- On-Balance Volume (OBV): The OBV values have been fluctuating, indicating indecision among investors.
- Chaikin Money Flow (CMF): The CMF values have been negative, reflecting selling pressure in the stock.
Key Observations:
- The stock is currently in a bearish trend based on moving averages and MACD analysis.
- Momentum indicators suggest oversold conditions, potentially signaling a reversal in the stock's price.
- Volatility indicators point towards a potential reversal as the stock nears oversold levels.
- Volume indicators show mixed signals, indicating uncertainty among market participants.
Conclusion:
Based on the analysis of the technical indicators, the next few days may see a potential reversal in CG stock's price movement. The stock has been in a bearish trend, but oversold conditions indicated by momentum and volatility indicators could lead to a short-term bullish reversal. Investors should closely monitor the price action and key support/resistance levels for confirmation of a trend reversal.