Technical Analysis of CGEN 2024-05-10
Overview:
In analyzing the technical indicators for CGEN over the last 5 days, we will delve into the trends, momentum, volatility, and volume indicators to provide a comprehensive outlook on the possible stock price movement in the coming days. By examining these key aspects, we aim to offer valuable insights and predictions for potential investors.
Trend Analysis:
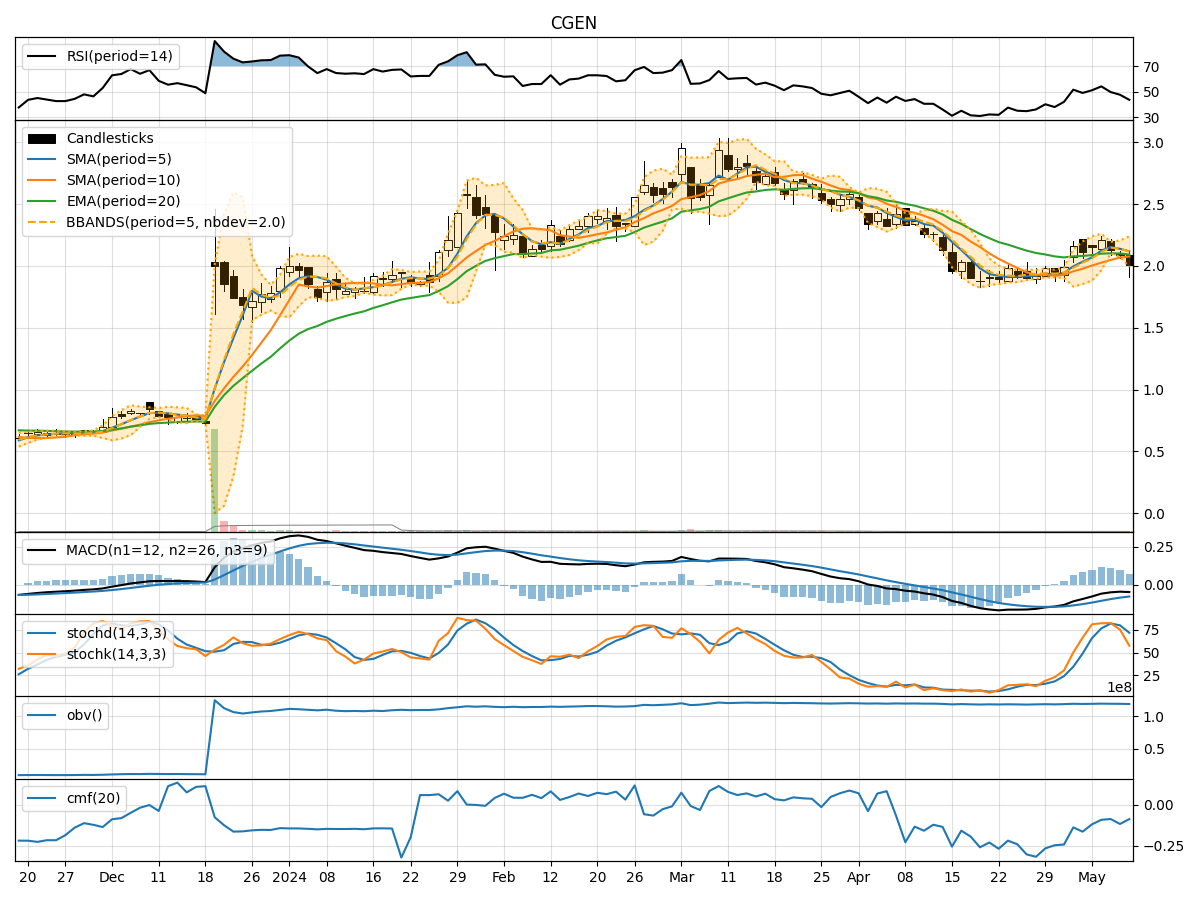
- Moving Averages (MA): The 5-day Moving Average (MA) has been fluctuating around the closing prices, indicating short-term price trends. The Simple Moving Average (SMA) and Exponential Moving Average (EMA) show a slight upward trend, suggesting a potential bullish sentiment.
- MACD: The Moving Average Convergence Divergence (MACD) has been negative but showing signs of convergence towards the signal line, hinting at a possible trend reversal.
- Conclusion: The trend indicators suggest a potential bullish reversal in the stock price.
Momentum Analysis:
- RSI: The Relative Strength Index (RSI) has been hovering around the neutral zone, indicating a balanced momentum between buying and selling pressure.
- Stochastic Oscillator: Both %K and %D levels have been declining, signaling a bearish momentum.
- Williams %R: The Williams %R is in the oversold territory, suggesting a potential buying opportunity.
- Conclusion: The momentum indicators reflect a mixed sentiment with a slight bearish bias.
Volatility Analysis:
- Bollinger Bands: The Bollinger Bands are narrowing, indicating decreasing volatility and a potential price breakout in the near future.
- Conclusion: The volatility indicators point towards a potential price breakout or significant movement.
Volume Analysis:
- On-Balance Volume (OBV): The OBV has been relatively stable, suggesting a balance between buying and selling pressure.
- Chaikin Money Flow (CMF): The CMF is negative, indicating a slight outflow of money from the stock.
- Conclusion: The volume indicators imply a neutral stance with no clear direction.
Overall Conclusion:
Based on the analysis of trend, momentum, volatility, and volume indicators, the stock price of CGEN is likely to experience a bullish reversal in the coming days. The narrowing Bollinger Bands and convergence of MACD signal a potential breakout to the upside. However, the mixed momentum signals and neutral volume indicators suggest a cautious approach. Traders may consider buying opportunities on dips with a target price towards the recent highs. It is essential to monitor the price action closely for confirmation of the bullish trend and adjust strategies accordingly.