Technical Analysis of CGNX 2024-05-10
Overview:
In analyzing the technical indicators for CGNX over the last 5 days, we will delve into the trend, momentum, volatility, and volume indicators to provide a comprehensive outlook on the possible stock price movement. By examining these key aspects, we aim to offer valuable insights and predictions for the upcoming days.
Trend Analysis:
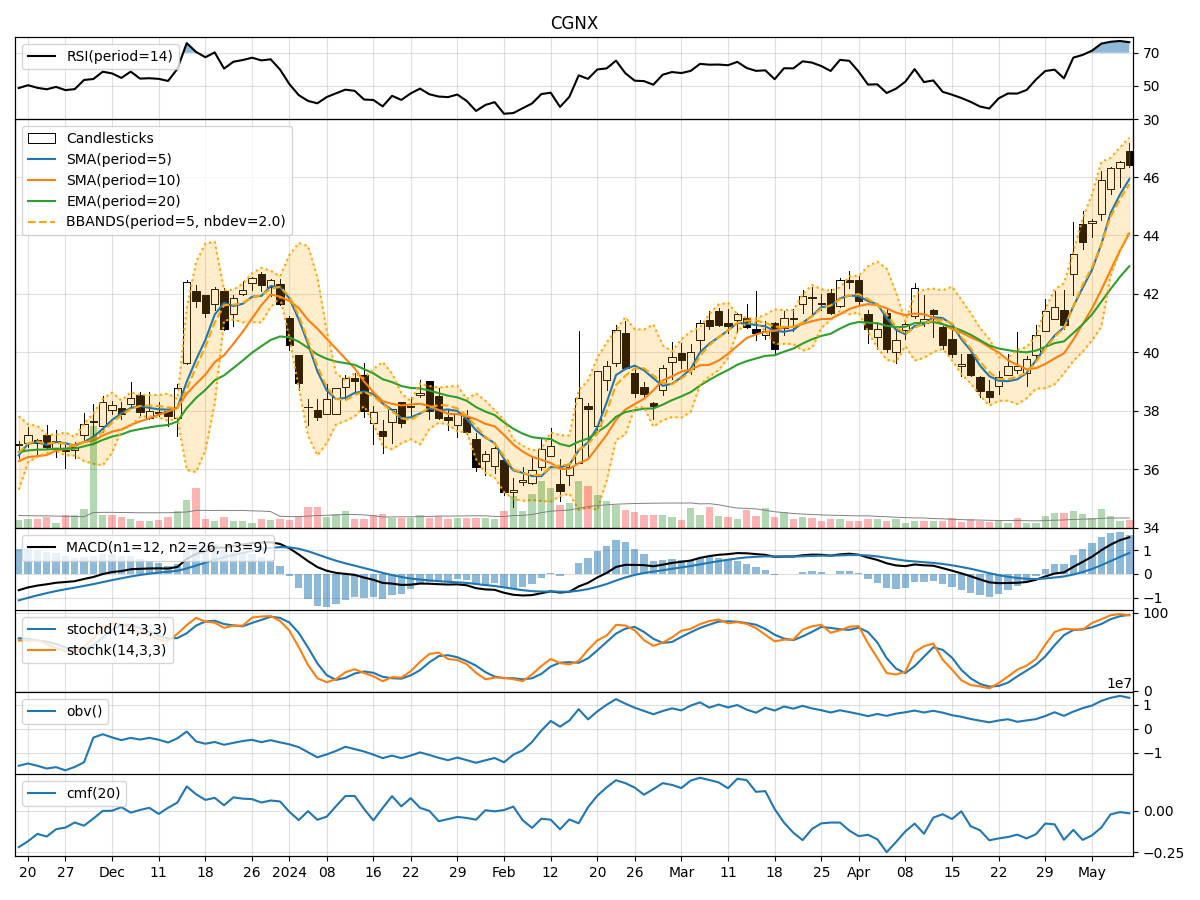
- Moving Averages (MA): The 5-day Moving Average has been consistently rising, indicating a bullish trend in the short term.
- MACD: The MACD line has been above the signal line for all 5 days, suggesting a bullish momentum.
- EMA: The Exponential Moving Average has also been trending upwards, supporting the bullish sentiment.
Momentum Analysis:
- RSI: The Relative Strength Index has been in the overbought territory, indicating a strong bullish momentum.
- Stochastic Oscillator: Both %K and %D have been in the overbought zone, signaling a potential reversal or consolidation.
- Williams %R: The Williams %R has been fluctuating in the oversold and overbought regions, suggesting mixed momentum.
Volatility Analysis:
- Bollinger Bands: The stock price has been trading near the upper Bollinger Band, indicating high volatility and a potential overbought condition.
- Bollinger %B: The %B indicator has been above 0.8, suggesting a potential overbought situation.
Volume Analysis:
- On-Balance Volume (OBV): The OBV has been fluctuating, indicating indecision among investors.
- Chaikin Money Flow (CMF): The CMF has been negative, suggesting selling pressure in the stock.
Key Observations:
- The trend indicators point towards a strong bullish sentiment in the short term.
- Momentum indicators show a potential overbought condition, signaling a need for caution.
- Volatility indicators indicate high volatility and a possible overbought scenario.
- Volume indicators reflect indecision among investors and selling pressure.
Conclusion:
Based on the analysis of the technical indicators, the next few days for CGNX are likely to see a continuation of the bullish trend in the short term. However, caution is advised due to the overbought signals from momentum indicators and high volatility as indicated by Bollinger Bands. Investors should closely monitor the price action and consider taking profits or implementing risk management strategies to navigate the potential market fluctuations.