Technical Analysis of CHEK 2024-05-10
Overview:
In analyzing the technical indicators for CHEK over the last 5 days, we will delve into the trend, momentum, volatility, and volume indicators to provide a comprehensive outlook on the possible stock price movement. By examining these key factors, we aim to offer valuable insights and predictions for the upcoming trading days.
Trend Analysis:
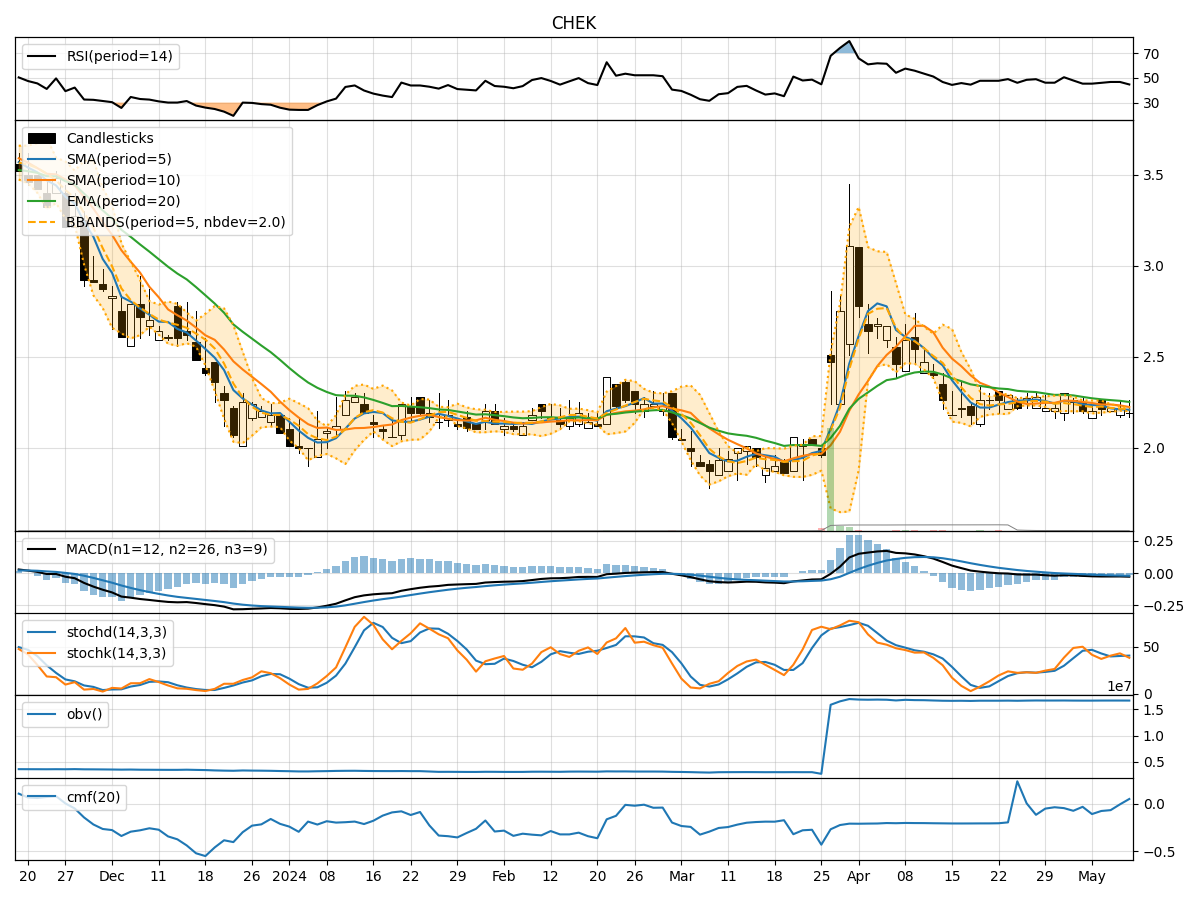
- Moving Averages (MA): The 5-day MA has been consistently below the closing price, indicating a short-term downtrend.
- MACD: The MACD line has been negative, suggesting bearish momentum in the stock.
- EMA: The exponential moving average has been declining, further supporting the bearish trend.
Key Observation: The trend indicators point towards a downward trajectory for CHEK.
Momentum Analysis:
- RSI: The Relative Strength Index has been hovering around 45-47, indicating neutral momentum.
- Stochastic Oscillator: Both %K and %D have been fluctuating in the mid-range, reflecting indecision in momentum.
- Williams %R: The indicator has shown oversold conditions but has not led to a significant reversal.
Key Observation: Momentum indicators suggest a sideways movement with no clear direction.
Volatility Analysis:
- Bollinger Bands: The bands have been narrowing, indicating decreasing volatility.
- Bollinger %B: The %B has been fluctuating within a tight range, reflecting stability in price movements.
Key Observation: Volatility indicators signal a consolidation phase for CHEK.
Volume Analysis:
- On-Balance Volume (OBV): The OBV has been relatively flat, suggesting a balance between buying and selling pressure.
- Chaikin Money Flow (CMF): The CMF has been negative, indicating outflows from the stock.
Key Observation: Volume indicators imply a neutral stance with no significant accumulation or distribution.
Conclusion:
Based on the analysis of trend, momentum, volatility, and volume indicators, the overall outlook for CHEK in the next few days is bearish with a downward bias. The stock is likely to continue its downward trend, supported by the negative MACD and declining moving averages. While momentum indicators suggest a sideways movement, the lack of clear direction in volume and the stability in volatility point towards a consolidation phase.
Key Conclusion: The next few days for CHEK are likely to see a downward movement with a consolidation pattern, indicating a bearish sentiment in the stock. Investors should exercise caution and consider potential short-term selling opportunities.