Technical Analysis of CJET 2024-05-10
Overview:
In analyzing the technical indicators for CJET over the last 5 days, we will delve into the trend, momentum, volatility, and volume indicators to provide a comprehensive outlook on the possible stock price movement. By examining these key aspects, we aim to offer valuable insights and predictions for the upcoming days.
Trend Analysis:
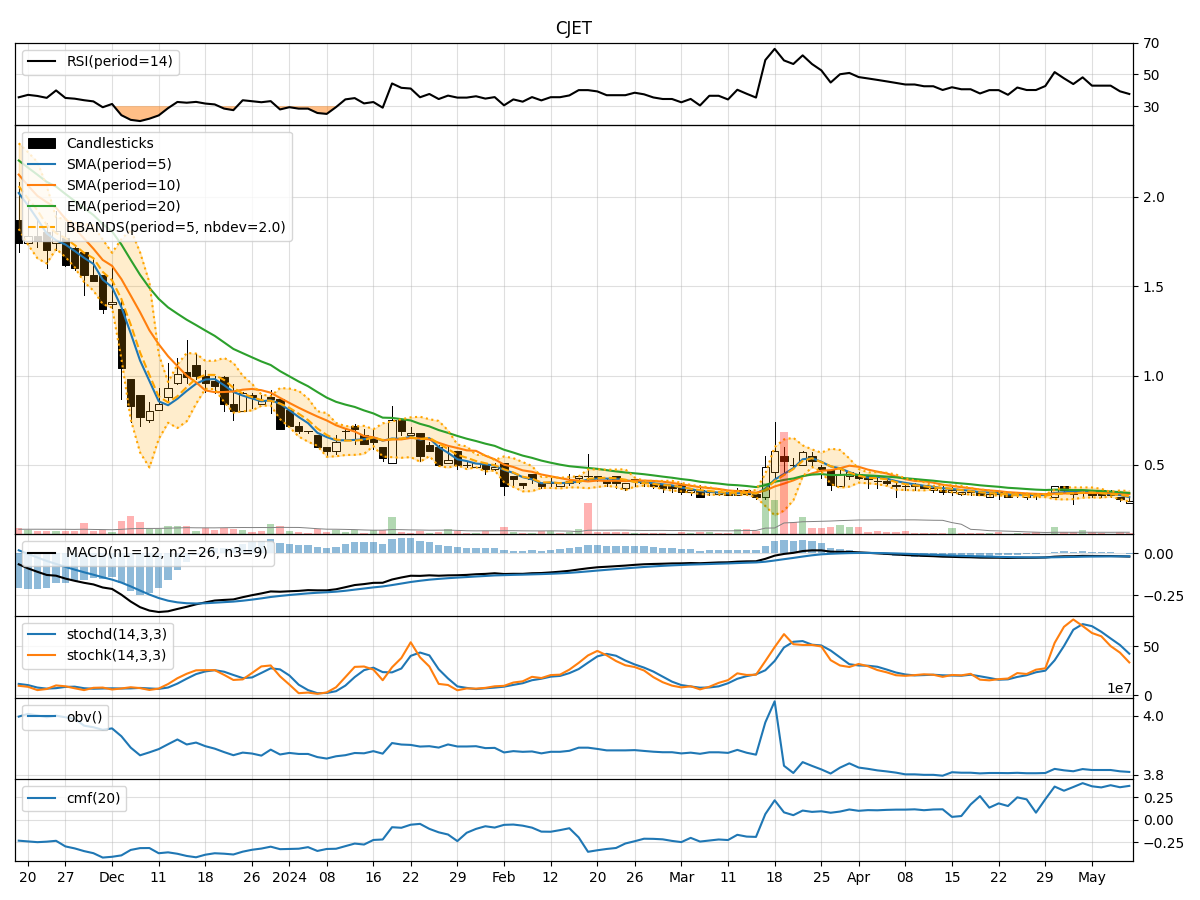
- Moving Averages (MA): The 5-day MA has been consistently below the closing price, indicating a downward trend.
- MACD: The MACD line has been negative, suggesting bearish momentum in the stock.
- EMA: The EMA has been declining, further supporting the bearish trend.
Key Observation: The trend indicators point towards a downward trajectory for CJET.
Momentum Analysis:
- RSI: The RSI has been decreasing, reflecting weakening momentum.
- Stochastic Oscillator: Both %K and %D have been declining, indicating a loss in buying pressure.
- Williams %R: The indicator has been in oversold territory, signaling a potential reversal.
Key Observation: Momentum indicators suggest a bearish sentiment in the stock.
Volatility Analysis:
- Bollinger Bands (BB): The stock price has been consistently below the lower Bollinger Band, indicating oversold conditions.
- BB Width: The bands have been narrowing, suggesting reduced volatility.
- BB %B: The %B indicator has been below 0.2, signaling potential undervaluation.
Key Observation: Volatility indicators imply a potential reversal or consolidation in the stock price.
Volume Analysis:
- On-Balance Volume (OBV): The OBV has been declining, indicating selling pressure.
- Chaikin Money Flow (CMF): The CMF has been fluctuating but generally positive, suggesting some buying interest.
Key Observation: Volume indicators show a mixed sentiment with selling pressure but some buying interest.
Conclusion:
Based on the analysis of trend, momentum, volatility, and volume indicators, the overall outlook for CJET in the next few days appears bearish. The stock is likely to continue its downward trend with weakening momentum and oversold conditions. However, the narrowing Bollinger Bands and potential reversal signals from the Williams %R indicator could lead to a short-term consolidation before any further downward movement.
In conclusion, the next few days for CJET are likely to see a continuation of the downward trend with a possibility of short-term consolidation based on the technical indicators analyzed. Investors should exercise caution and consider risk management strategies in their decision-making process.