Technical Analysis of CJJD 2024-05-10
Overview:
In analyzing the technical indicators for CJJD over the last 5 days, we will delve into the trend, momentum, volatility, and volume indicators to provide a comprehensive outlook on the possible stock price movement. By examining these key factors, we aim to offer valuable insights and predictions for the upcoming days.
Trend Analysis:
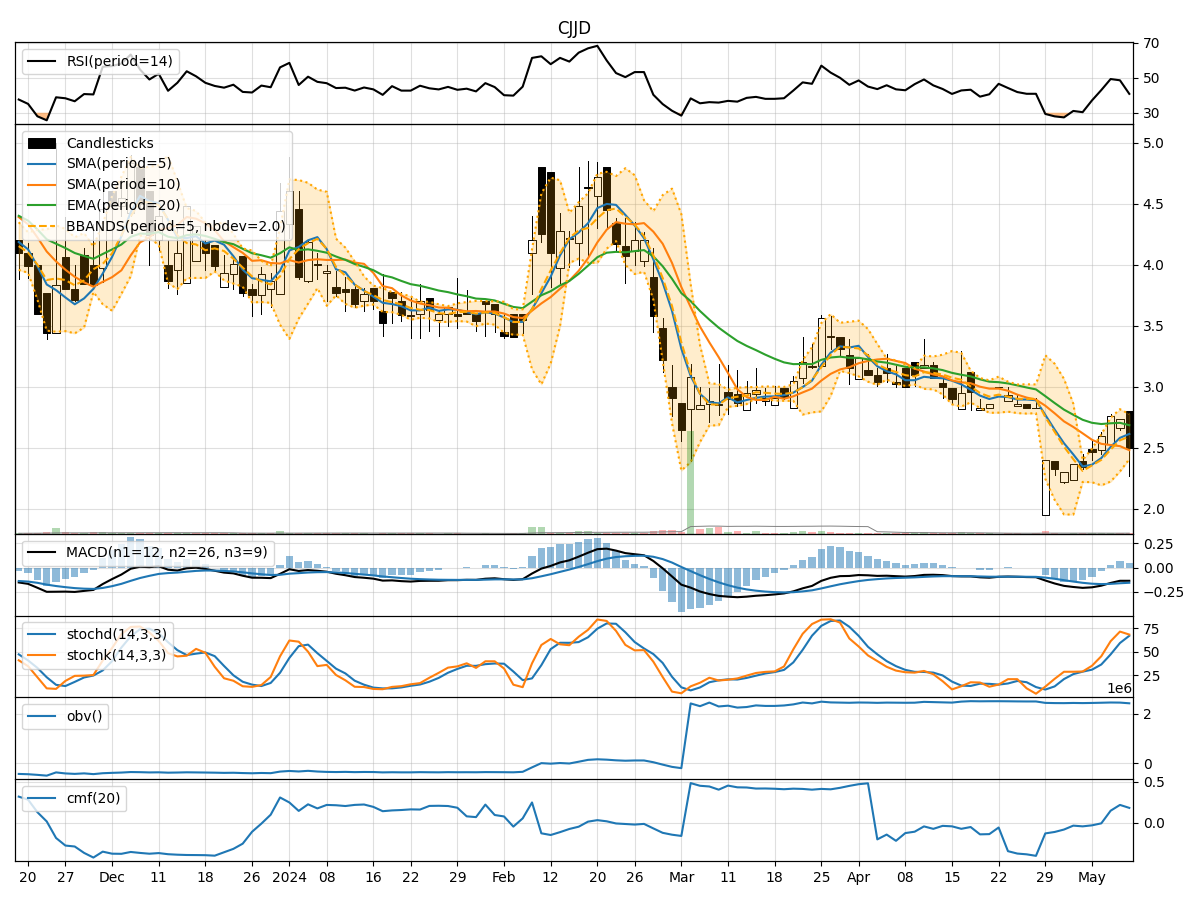
- Moving Averages (MA): The 5-day Moving Average (MA) has been fluctuating around the closing prices, indicating short-term price trends. The Simple Moving Average (SMA) and Exponential Moving Average (EMA) show a slight downward trend, with the EMA slightly below the SMA.
- MACD: The Moving Average Convergence Divergence (MACD) has been negative but showing signs of convergence towards the signal line, suggesting a potential reversal in the short term.
Momentum Analysis:
- RSI: The Relative Strength Index (RSI) has been hovering around the mid-range, indicating a balanced momentum between buying and selling pressure.
- Stochastic Oscillator: Both %K and %D of the Stochastic Oscillator have been in the overbought territory, suggesting a potential reversal or consolidation phase.
- Williams %R: The Williams %R is in the oversold region, indicating a possible buying opportunity.
Volatility Analysis:
- Bollinger Bands (BB): The Bollinger Bands have been widening, indicating increased volatility in the stock price. The current price is near the lower band, suggesting a potential bounce back towards the middle band.
- Bollinger %B: The %B indicator is below 1, indicating that the stock price is trading below the lower Bollinger Band, potentially oversold.
Volume Analysis:
- On-Balance Volume (OBV): The OBV has been relatively stable, indicating a balance between buying and selling pressure.
- Chaikin Money Flow (CMF): The CMF has shown a positive trend over the past few days, indicating buying pressure in the stock.
Conclusion:
Based on the technical indicators analyzed: - Trend: The stock is currently in a downtrend based on moving averages, but the MACD shows signs of a potential reversal. - Momentum: The momentum indicators suggest a mixed signal, with the RSI indicating balance, Stochastic Oscillator hinting at a potential reversal, and Williams %R signaling a buying opportunity. - Volatility: The stock is experiencing increased volatility, as indicated by the widening Bollinger Bands and %B below 1. - Volume: The volume indicators show a balanced market, with stable OBV and positive CMF.
Overall Assessment:
Considering the analysis of trend, momentum, volatility, and volume indicators, the next few days for CJJD could see potential consolidation or a short-term reversal in the downtrend. Traders should closely monitor the MACD for confirmation of a trend reversal and watch for signals from the Stochastic Oscillator and Williams %R for potential entry points. Additionally, the volatility in the stock price may present trading opportunities for those comfortable with higher risk levels.