Technical Analysis of CLGN 2024-05-10
Overview:
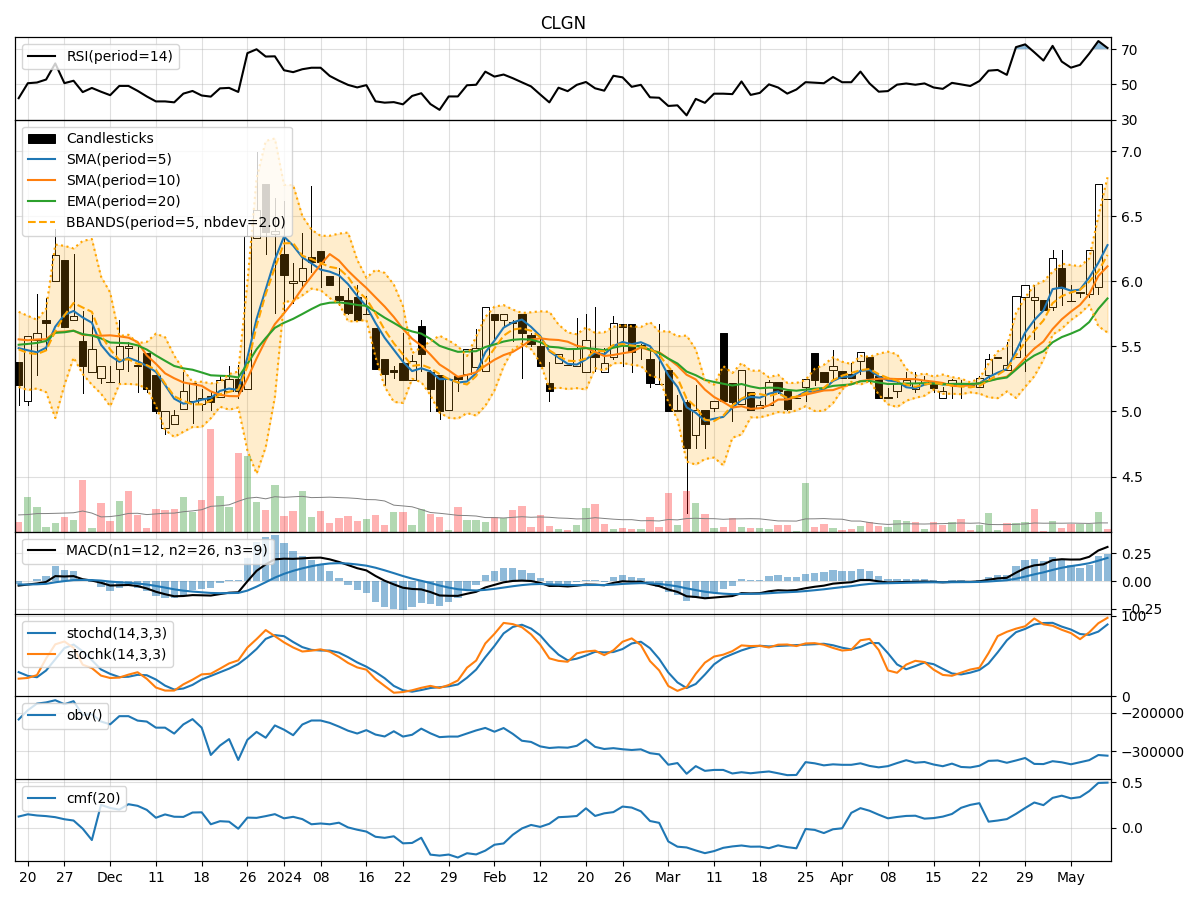
In analyzing the technical indicators for CLGN over the last 5 days, we will delve into the trend, momentum, volatility, and volume indicators to provide a comprehensive outlook on the possible stock price movement. By examining these key factors, we aim to offer valuable insights and predictions for the upcoming days.
Trend Analysis:
- Moving Averages (MA): The 5-day Moving Average (MA) has been showing an upward trend, indicating a positive momentum in the stock price.
- MACD: The Moving Average Convergence Divergence (MACD) has been consistently increasing, suggesting a strengthening bullish trend.
- EMA: The Exponential Moving Average (EMA) has been on the rise, supporting the bullish sentiment in the short to medium term.
Momentum Analysis:
- RSI: The Relative Strength Index (RSI) has been climbing, reaching overbought levels, indicating a strong buying momentum.
- Stochastic Oscillator: Both %K and %D have been increasing, signaling a bullish momentum in the stock.
- Williams %R: The Williams %R is in the oversold territory, suggesting a potential reversal in the short term.
Volatility Analysis:
- Bollinger Bands: The Bollinger Bands have been widening, indicating increased volatility in the stock price.
- Bollinger %B: The %B indicator has been fluctuating within the bands, reflecting the volatility in the price movements.
Volume Analysis:
- On-Balance Volume (OBV): The OBV has been fluctuating, indicating mixed buying and selling pressure in the stock.
- Chaikin Money Flow (CMF): The CMF has been on the rise, suggesting a bullish accumulation phase in the stock.
Key Observations:
- The trend indicators suggest a strong bullish sentiment in the stock price, supported by the moving averages and MACD.
- Momentum indicators indicate a robust buying momentum, with RSI in the overbought zone and Stochastic Oscillator showing bullish signals.
- Volatility has been increasing, as seen in the widening Bollinger Bands, which may lead to larger price swings.
- Volume indicators show mixed signals, with OBV fluctuating and CMF indicating bullish accumulation.
Conclusion:
Based on the analysis of the technical indicators, the stock price of CLGN is likely to continue its upward trajectory in the next few days. The strong bullish trend, supported by momentum indicators and increasing volatility, suggests that the stock may experience further price appreciation. Traders and investors could consider buying opportunities in CLGN, as the overall outlook remains bullish. It is essential to monitor the price action closely and set appropriate stop-loss levels to manage risk effectively.