Technical Analysis of CLLS 2024-05-10
Overview:
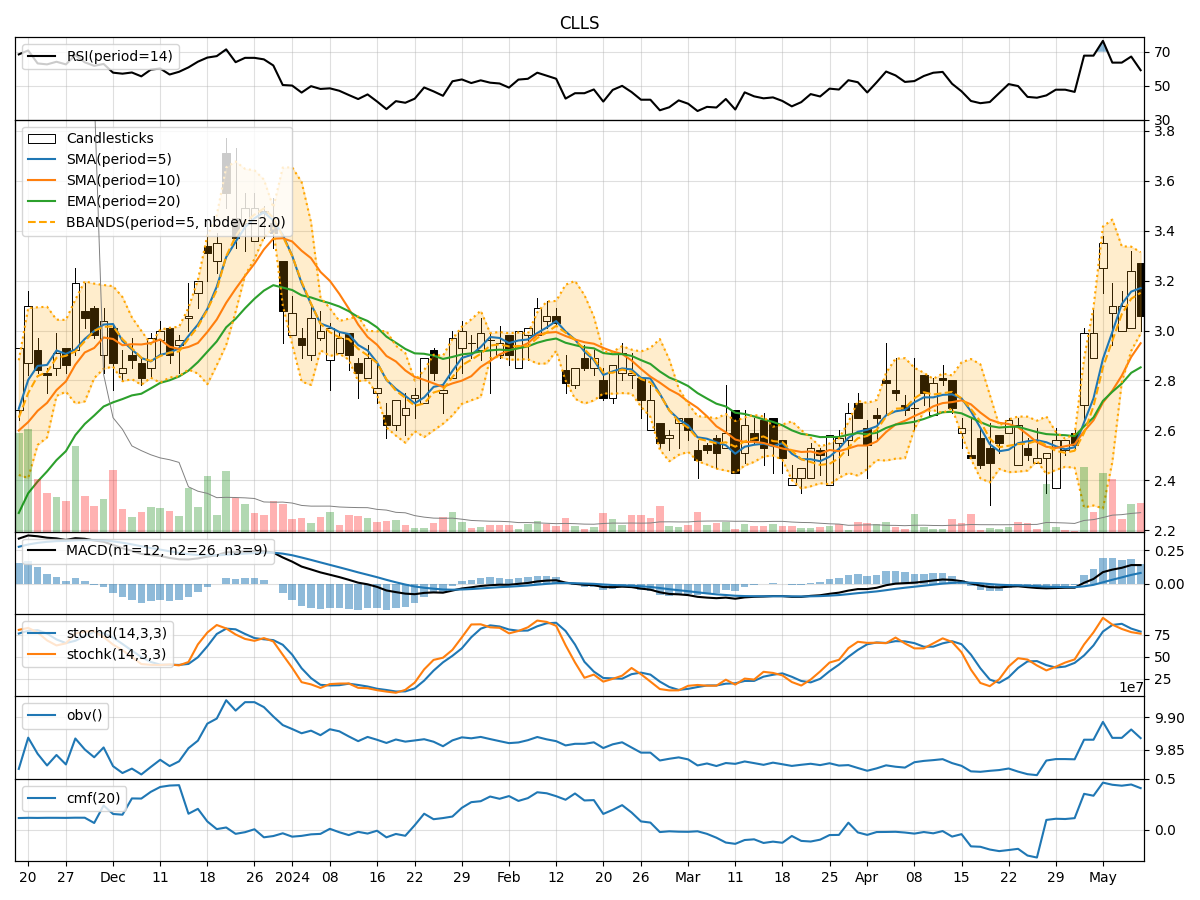
In analyzing the technical indicators for CLLS over the last 5 days, we will delve into the trend, momentum, volatility, and volume indicators to provide a comprehensive outlook on the possible stock price movement in the coming days.
Trend Analysis:
- Moving Averages (MA): The 5-day Moving Average (MA) has been consistently above the closing prices, indicating a bullish trend.
- MACD: The MACD line has been consistently above the signal line, suggesting a bullish momentum.
- EMA: The Exponential Moving Average (EMA) has been trending upwards, supporting the bullish sentiment.
Momentum Analysis:
- RSI: The Relative Strength Index (RSI) has been fluctuating but generally staying within the neutral to overbought territory.
- Stochastic Oscillator: Both %K and %D have been in the overbought zone, indicating a potential reversal.
- Williams %R: The Williams %R has been fluctuating in the oversold territory, suggesting a possible buying opportunity.
Volatility Analysis:
- Bollinger Bands: The stock price has been trading within the Bollinger Bands, with the bands narrowing, indicating reduced volatility.
- Bollinger %B: The %B indicator has been fluctuating within the bands, suggesting a balanced market sentiment.
Volume Analysis:
- On-Balance Volume (OBV): The OBV has shown mixed signals, indicating indecision among investors.
- Chaikin Money Flow (CMF): The CMF has been positive but fluctuating, reflecting uncertainty in the market sentiment.
Key Observations:
- The trend indicators suggest a bullish sentiment with moving averages and MACD supporting upward momentum.
- Momentum indicators show mixed signals with RSI in the neutral zone, Stochastic Oscillator indicating overbought conditions, and Williams %R fluctuating in oversold territory.
- Volatility indicators point towards reduced volatility and a potential consolidation phase.
- Volume indicators reflect indecision among investors with OBV showing mixed signals and CMF fluctuating positively.
Conclusion:
Based on the analysis of technical indicators, the stock price of CLLS is likely to experience sideways movement or consolidation in the coming days. The bullish trend indicated by moving averages and MACD may face resistance due to mixed signals from momentum indicators and uncertainty in volume and volatility indicators. Traders should exercise caution and wait for clearer signals before making significant trading decisions.