Technical Analysis of CLRC 2024-05-10
Overview:
In analyzing the technical indicators for CLRC over the last 5 days, we will delve into the trend, momentum, volatility, and volume indicators to provide a comprehensive outlook on the possible stock price movement. By examining these key aspects, we aim to offer valuable insights and predictions for the upcoming days.
Trend Analysis:
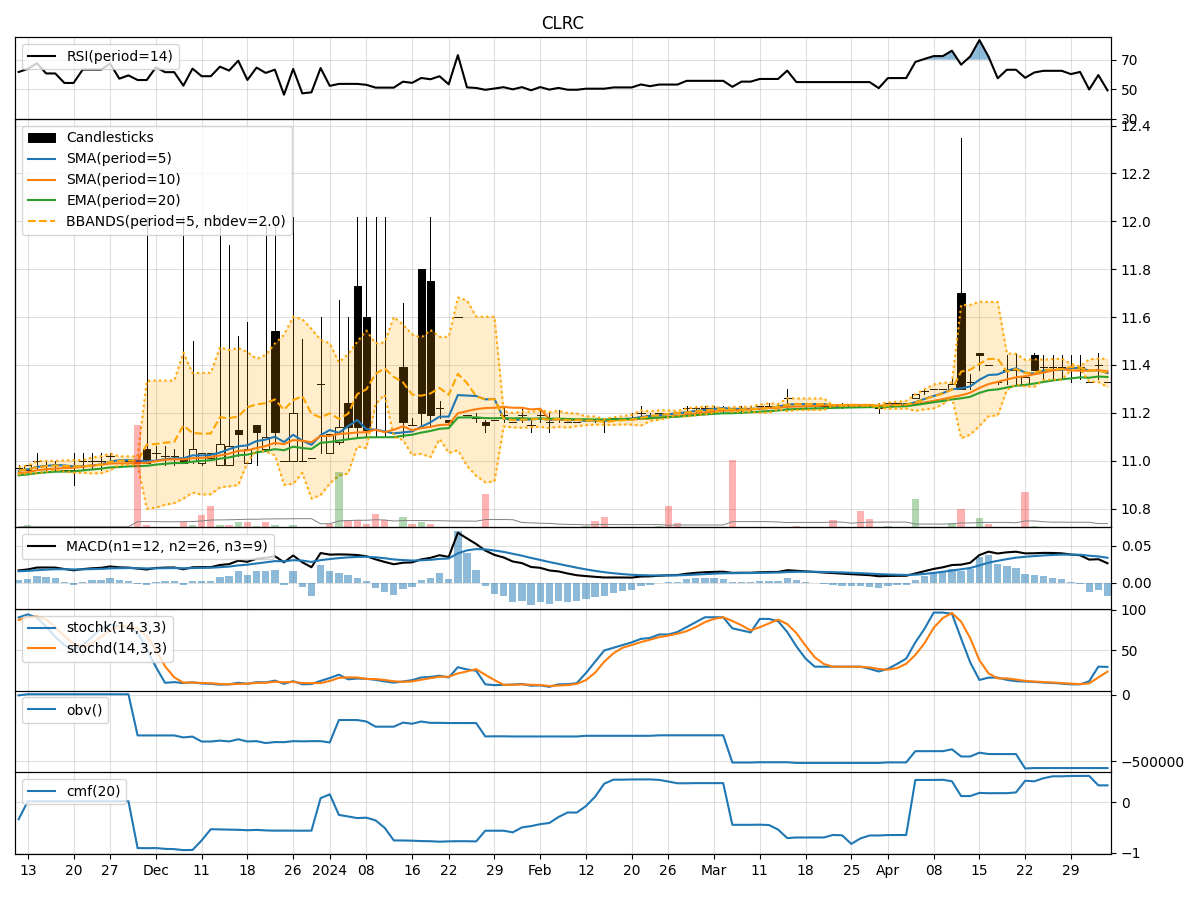
- Moving Averages (MA): The 5-day MA has been fluctuating around the closing prices, indicating a lack of clear trend direction.
- MACD: The MACD line has been positive but decreasing, while the MACD Histogram has been negative, suggesting a potential bearish momentum.
Momentum Analysis:
- RSI: The RSI has been hovering around the neutral zone, indicating a lack of strong momentum in either direction.
- Stochastic Oscillator: Both %K and %D have been relatively low, signaling a potential oversold condition.
Volatility Analysis:
- Bollinger Bands (BB): The stock price has been trading within the bands, with the bands narrowing, suggesting decreasing volatility.
Volume Analysis:
- On-Balance Volume (OBV): The OBV has been slightly decreasing, indicating some selling pressure.
- Chaikin Money Flow (CMF): The CMF has been positive, suggesting accumulation in the stock.
Key Observations:
- The stock is currently in a consolidation phase with no clear trend direction.
- Momentum indicators show a lack of strong buying or selling pressure.
- Volatility has been decreasing, indicating a potential period of stability.
- Volume indicators suggest a slight increase in selling pressure.
Conclusion:
Based on the analysis of the technical indicators, the next few days for CLRC are likely to see sideways movement with limited volatility. The stock is expected to continue trading within a narrow range as it consolidates. Traders may consider adopting a cautious approach and wait for a clearer trend to emerge before making significant trading decisions.