Technical Analysis of CLVR 2024-05-10
Overview:
In analyzing the technical indicators for CLVR over the last 5 days, we will delve into the trend, momentum, volatility, and volume indicators to provide a comprehensive outlook on the possible stock price movement. By examining these key aspects, we aim to offer valuable insights and predictions for the upcoming days.
Trend Analysis:
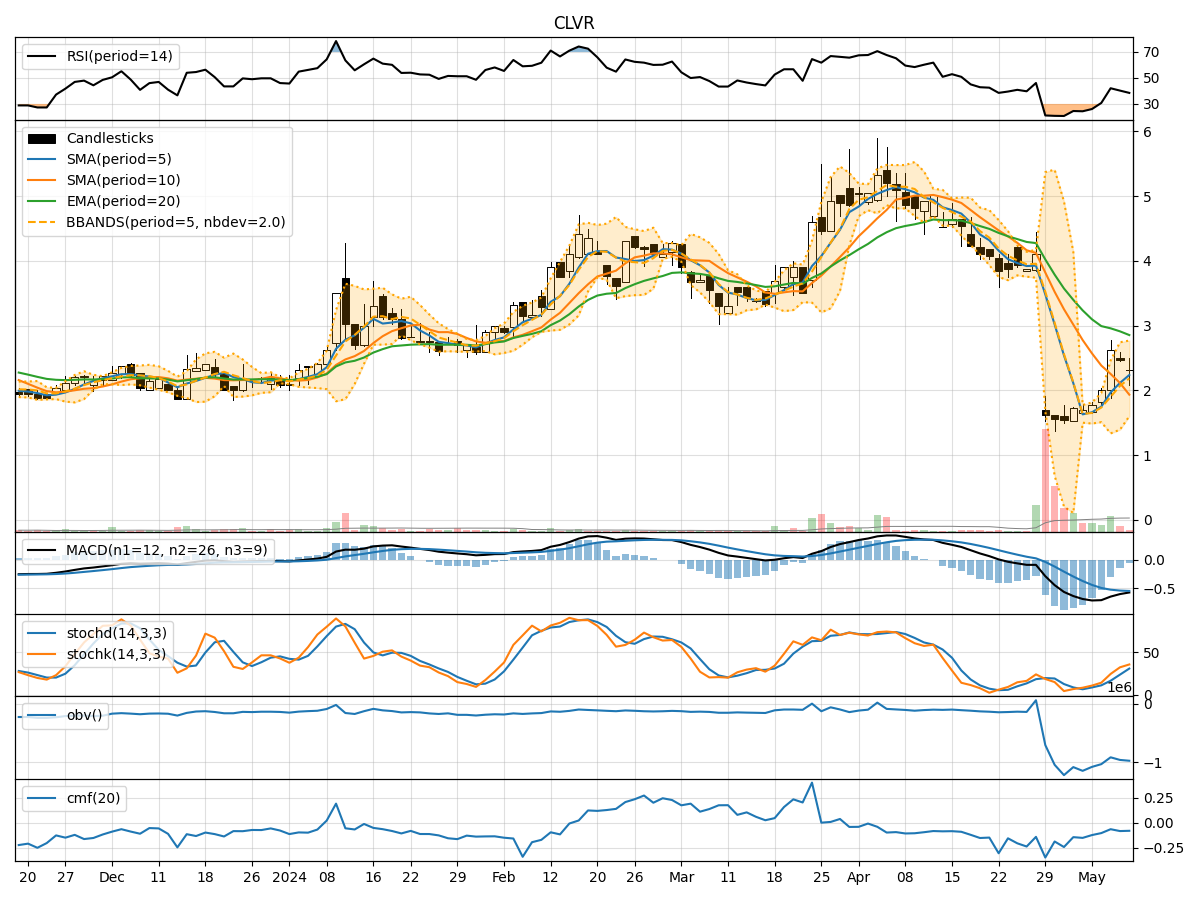
- Moving Averages (MA): The 5-day Moving Average (MA) has been declining steadily, indicating a bearish trend in the short term.
- MACD: The Moving Average Convergence Divergence (MACD) has been consistently negative, suggesting a bearish momentum in the stock.
- EMA: The Exponential Moving Average (EMA) has also been trending downwards, reinforcing the bearish sentiment in the stock.
Momentum Analysis:
- RSI: The Relative Strength Index (RSI) has been hovering around the oversold territory, indicating a potential reversal or consolidation phase.
- Stochastic Oscillator: Both %K and %D have been rising, suggesting a potential bullish momentum building up.
- Williams %R: The Williams %R is in the oversold region, indicating a possible buying opportunity.
Volatility Analysis:
- Bollinger Bands (BB): The Bollinger Bands have been narrowing, indicating decreasing volatility and a potential breakout in the near future.
- BB% (Bollinger Band %B): The BB% has been decreasing, signaling a period of consolidation or a potential reversal.
Volume Analysis:
- On-Balance Volume (OBV): The OBV has been declining, indicating selling pressure in the stock.
- Chaikin Money Flow (CMF): The CMF has been negative, suggesting outflow of money from the stock.
Key Observations:
- The trend indicators point towards a bearish sentiment in the stock, with moving averages and MACD signaling a downward trend.
- Momentum indicators show mixed signals, with RSI indicating potential reversal while Stochastic Oscillator and Williams %R hinting at a bullish momentum.
- Volatility indicators suggest a period of consolidation or a potential breakout in the near future.
- Volume indicators reflect selling pressure and negative money flow in the stock.
Conclusion:
Based on the analysis of the technical indicators, the stock price of CLVR is likely to experience further downward movement in the short term due to the bearish trend indicated by moving averages and MACD. However, the mixed signals from momentum indicators suggest a possible reversal or consolidation phase. Traders should exercise caution and closely monitor key levels for potential entry or exit points.