Technical Analysis of CME 2024-05-03
Overview:
In analyzing the technical indicators for CME over the last 5 days, we will delve into the trend, momentum, volatility, and volume indicators to provide a comprehensive outlook on the possible stock price movement in the coming days. By examining key metrics such as moving averages, MACD, RSI, Bollinger Bands, and OBV, we aim to offer valuable insights and predictions for potential price trends.
Trend Indicators:
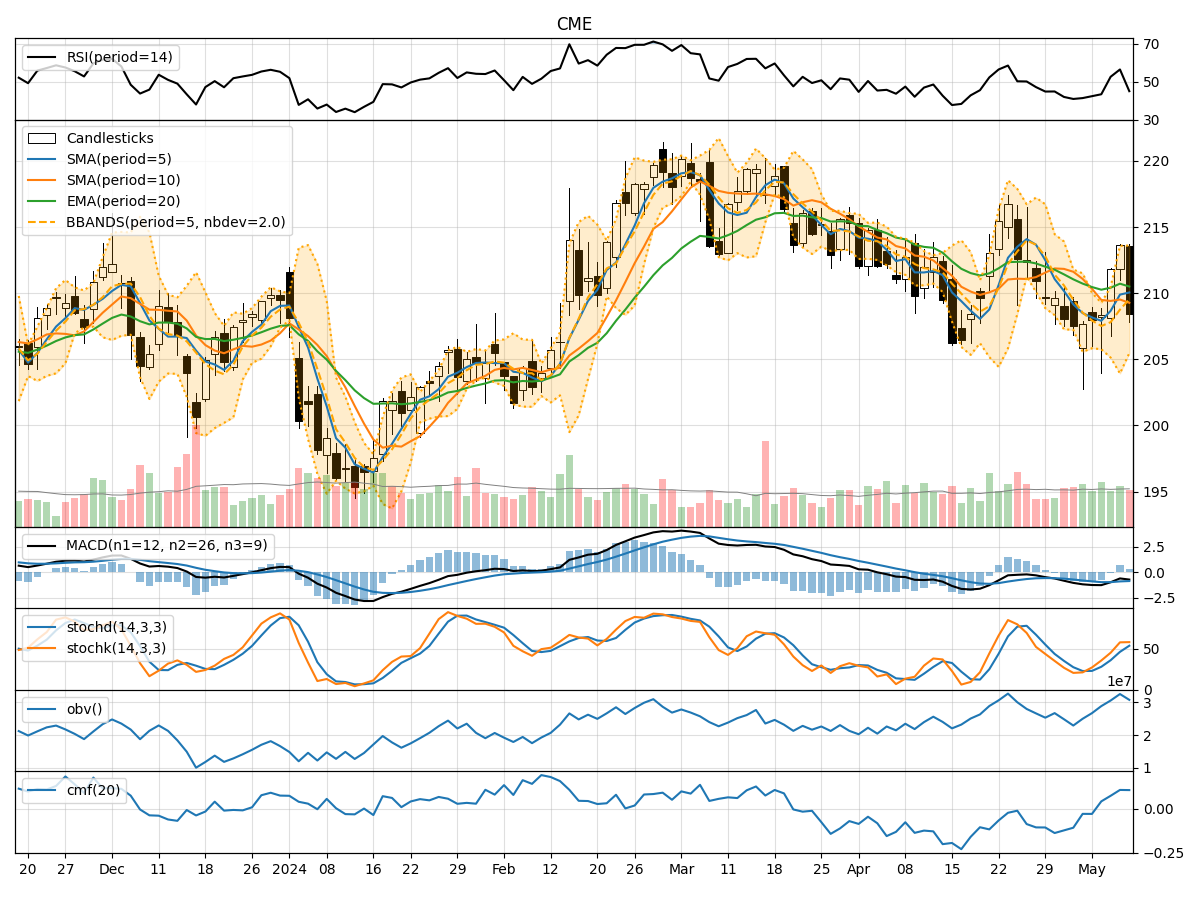
- Moving Averages (MA): The 5-day MA has been consistently below the closing prices, indicating a short-term downtrend.
- MACD: The MACD line has been decreasing, with the MACD histogram showing negative values, suggesting a bearish momentum.
- EMA: The EMA has also been declining, further supporting the bearish trend.
Momentum Indicators:
- RSI: The RSI has been hovering around 40-45, indicating a neutral to slightly bearish momentum.
- Stochastic Oscillator: Both %K and %D have been decreasing, signaling a bearish sentiment.
- Williams %R: The indicator has been in oversold territory, suggesting a potential reversal or continuation of the downtrend.
Volatility Indicators:
- Bollinger Bands: The stock price has been trading below the middle Bollinger Band, indicating a bearish trend.
- Bollinger %B: The %B indicator has been below 0.5, suggesting a bearish sentiment.
- Bollinger Band Width: The Band Width has been narrowing, indicating decreasing volatility.
Volume Indicators:
- On-Balance Volume (OBV): The OBV has been declining, reflecting selling pressure in the stock.
- Chaikin Money Flow (CMF): The CMF has been negative, indicating a bearish money flow trend.
Key Observations and Opinions:
- Trend: The trend indicators point towards a clear downward trend in the stock price.
- Momentum: Momentum indicators support a bearish sentiment with oversold conditions.
- Volatility: Volatility indicators suggest a decreasing volatility environment.
- Volume: Volume indicators reflect selling pressure and a bearish money flow trend.
Conclusion:
Based on the analysis of the technical indicators across trend, momentum, volatility, and volume, the overall outlook for CME stock in the next few days is bearish. The stock is likely to continue its downward trajectory, with potential for further price declines. Traders and investors should exercise caution and consider shorting or staying on the sidelines until a clear reversal pattern emerges.