Technical Analysis of CMND 2024-05-10
Overview:
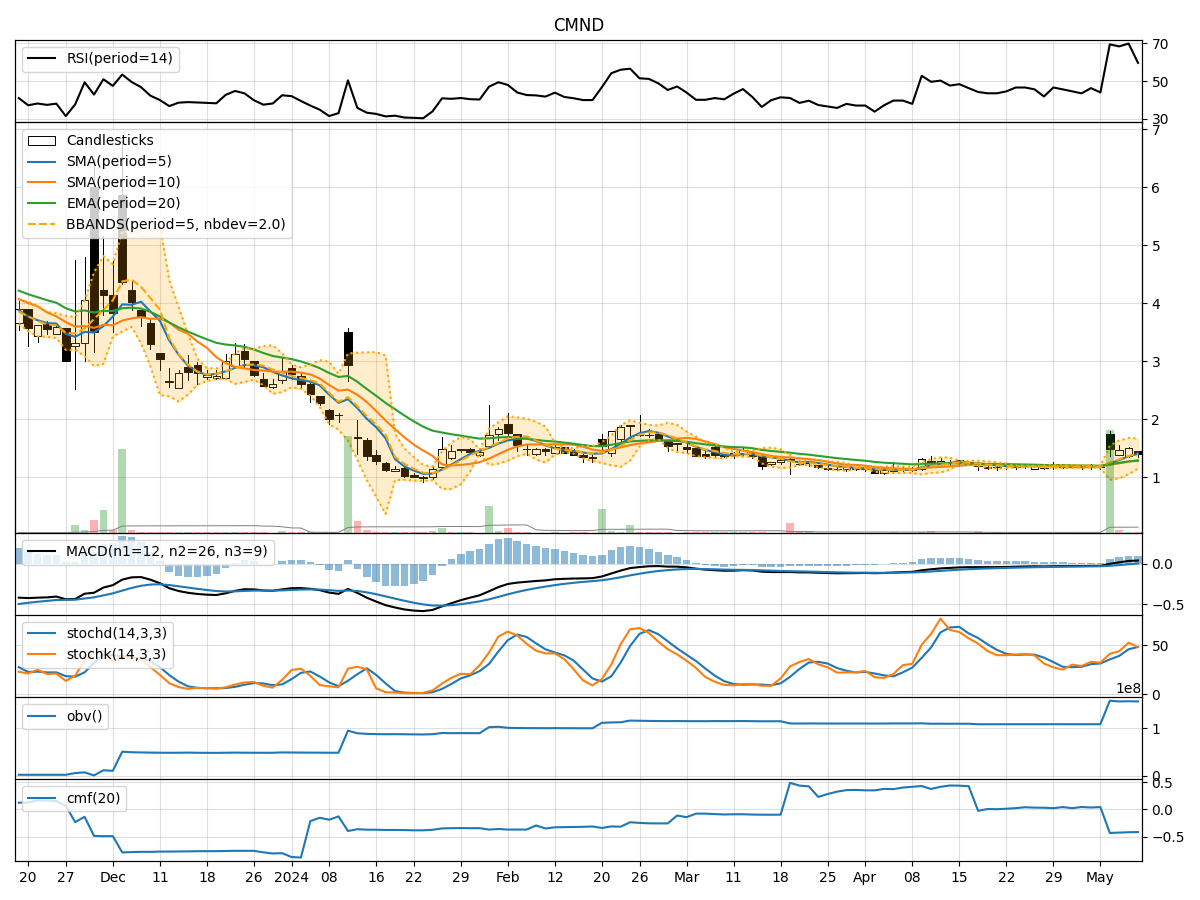
In analyzing the technical indicators for CMND stock over the last 5 days, we will delve into the trend, momentum, volatility, and volume indicators to provide a comprehensive outlook on the possible stock price movement in the coming days. By examining key metrics such as moving averages, MACD, RSI, Bollinger Bands, and OBV, we aim to offer valuable insights and predictions for potential price action.
Trend Analysis:
- Moving Averages (MA): The 5-day MA has been showing an upward trend, indicating a positive momentum in the stock price.
- MACD: The MACD line has been consistently above the signal line, suggesting a bullish trend in the short term.
Momentum Analysis:
- RSI: The RSI has been fluctuating but generally staying within the neutral to overbought territory, indicating some bullish momentum.
- Stochastic Oscillator: Both %K and %D have been moving upwards, signaling increasing buying pressure.
Volatility Analysis:
- Bollinger Bands: The stock price has been trading within the upper Bollinger Band, indicating a period of high volatility and potential overbought conditions.
Volume Analysis:
- On-Balance Volume (OBV): The OBV has been relatively stable, showing a slight increase, which suggests a consistent accumulation of the stock by investors.
Key Observations:
- The stock is currently in an upward trend based on moving averages and MACD.
- Momentum indicators like RSI and Stochastic Oscillator suggest bullish sentiment in the market.
- Volatility is relatively high as the stock price is trading near the upper Bollinger Band.
- Volume indicators show a positive accumulation of the stock by investors.
Conclusion:
Based on the analysis of technical indicators, the next few days for CMND stock are likely to see a continuation of the upward trend. The bullish momentum supported by moving averages, MACD, RSI, and Stochastic Oscillator indicates a potential for further price appreciation. However, given the high volatility as indicated by the Bollinger Bands, there might be some short-term price fluctuations. Investors should consider buying on dips to capitalize on the overall bullish outlook for the stock.