Technical Analysis of CMPR 2024-05-10
Overview:
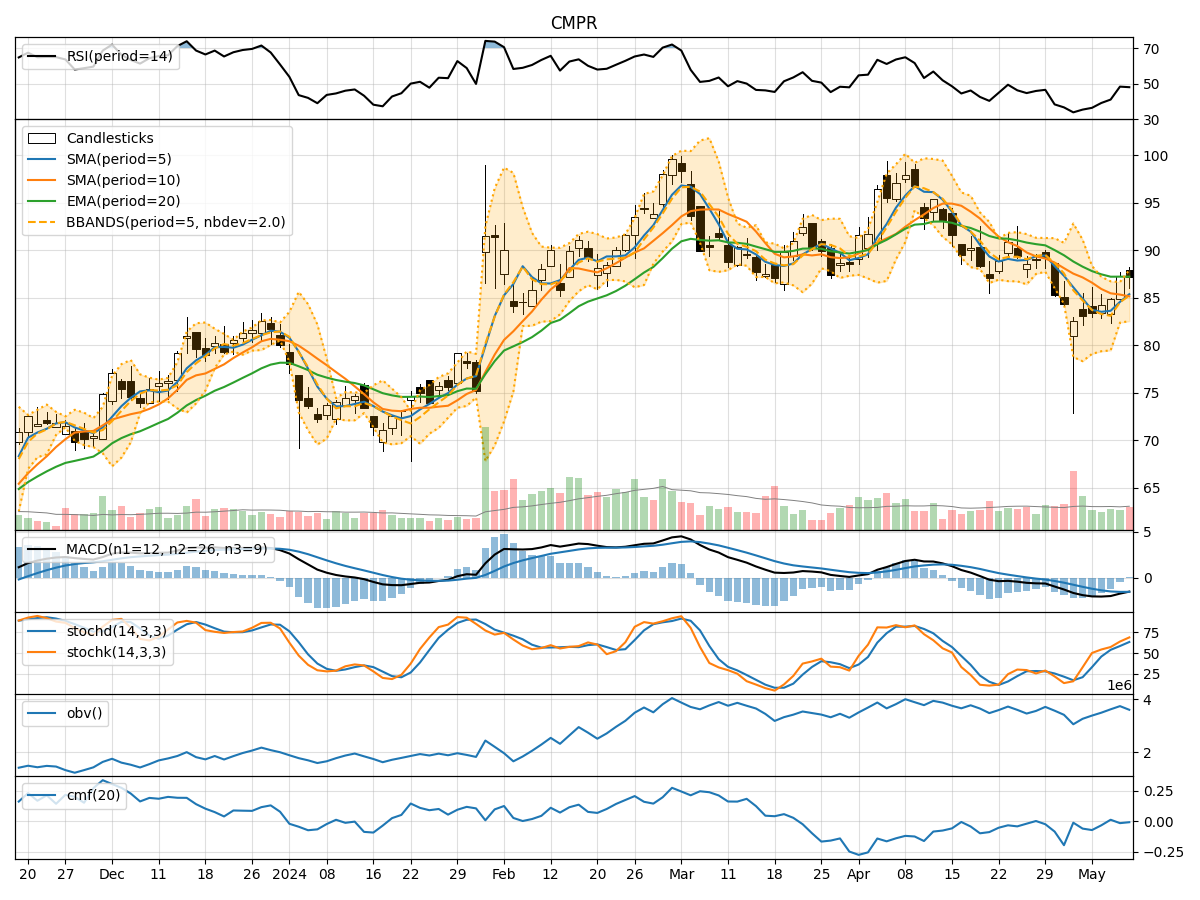
In analyzing the technical indicators for CMPR over the last 5 days, we will delve into the trend, momentum, volatility, and volume indicators to provide a comprehensive outlook on the possible stock price movement in the coming days.
Trend Indicators:
- Moving Averages (MA): The 5-day MA has been consistently below the closing prices, indicating a short-term downtrend.
- MACD: The MACD line has been below the signal line, suggesting a bearish momentum.
- RSI: The RSI has been below 50, indicating a bearish sentiment.
Momentum Indicators:
- Stochastic Oscillator: Both %K and %D have been rising, indicating increasing buying pressure.
- Williams %R: The indicator has been in oversold territory, suggesting a potential reversal.
Volatility Indicators:
- Bollinger Bands: The stock price has been trading within the bands, indicating a period of consolidation.
- BB% (Bollinger Band %B): The %B has been fluctuating around the midline, suggesting a lack of clear direction.
Volume Indicators:
- On-Balance Volume (OBV): The OBV has been fluctuating, indicating indecision among investors.
- Chaikin Money Flow (CMF): The CMF has been negative, suggesting selling pressure.
Key Observations:
- The trend indicators point towards a bearish sentiment with the MA, MACD, and RSI all indicating a downward trend.
- Momentum indicators show a potential reversal with the Stochastic Oscillator and Williams %R signaling a shift in momentum.
- Volatility indicators suggest a period of consolidation with the stock price trading within the Bollinger Bands.
- Volume indicators reflect indecision among investors with OBV fluctuating and CMF showing selling pressure.
Conclusion:
Based on the analysis of the technical indicators, the next few days' possible stock price movement for CMPR is likely to be sideways with a potential bullish bias. The momentum indicators suggest a possible reversal in the bearish trend, while volatility indicators indicate a period of consolidation. However, the overall trend indicators still point towards a bearish sentiment, so caution is advised. Traders should closely monitor key levels and wait for confirmation of a sustained upward movement before considering long positions.