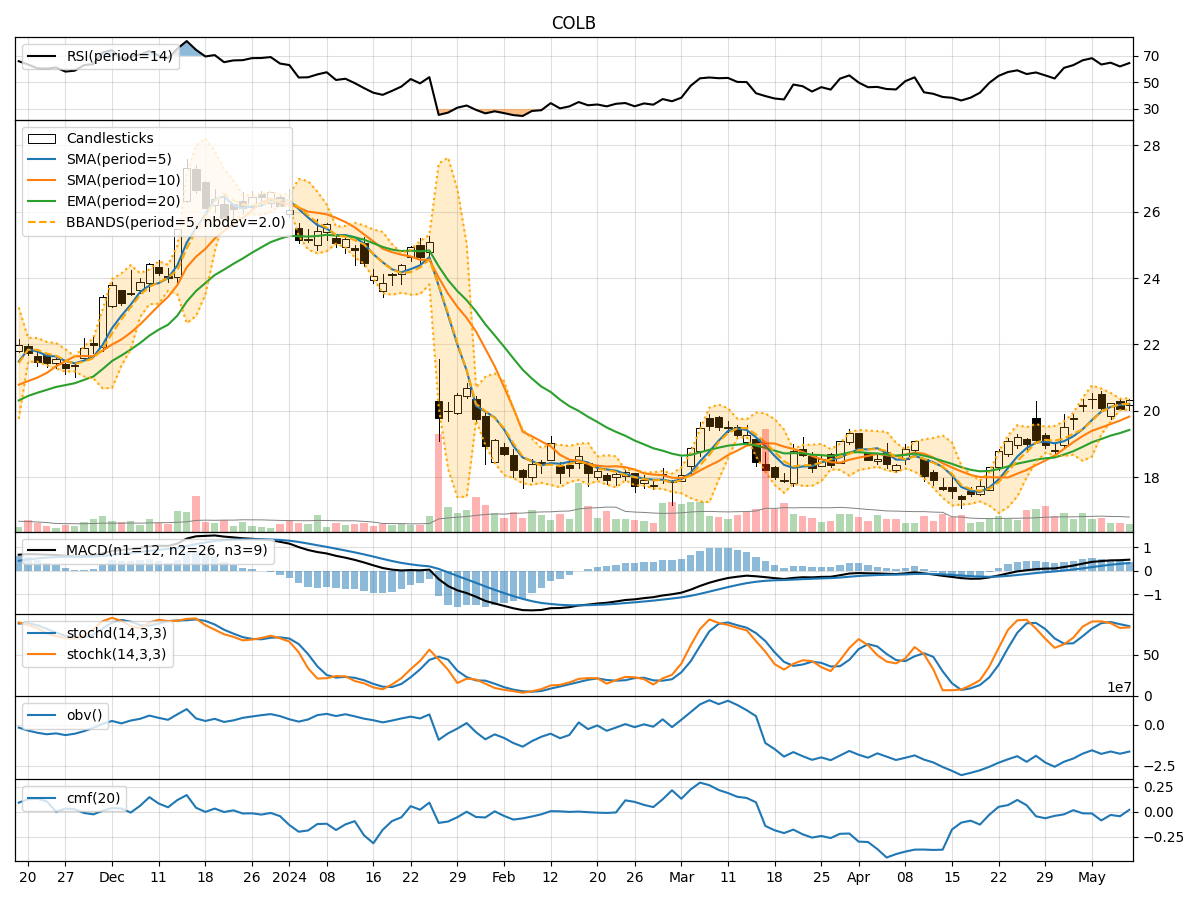
Technical Analysis of COLB 2024-05-10
Overview:
In analyzing the technical indicators for COLB over the last 5 days, we will delve into the trend, momentum, volatility, and volume indicators to provide a comprehensive outlook on the possible stock price movement in the coming days.
Trend Analysis:
- Moving Averages (MA): The 5-day Moving Average (MA) has been consistently above the Simple Moving Average (SMA) and Exponential Moving Average (EMA), indicating a bullish trend.
- MACD: The MACD line has been consistently above the signal line, with both lines showing an upward trend, suggesting bullish momentum.
Momentum Analysis:
- RSI: The Relative Strength Index (RSI) has been fluctuating around the 60-70 range, indicating a neutral momentum.
- Stochastic Oscillator: The Stochastic Oscillator has been hovering around the overbought territory, suggesting a potential reversal or consolidation.
Volatility Analysis:
- Bollinger Bands (BB): The stock price has been trading within the Bollinger Bands, with the bands narrowing, indicating decreasing volatility.
Volume Analysis:
- On-Balance Volume (OBV): The OBV has been fluctuating, indicating indecision among investors.
- Chaikin Money Flow (CMF): The CMF has been negative, suggesting selling pressure in the stock.
Key Observations:
- The trend indicators suggest a bullish sentiment in the short term.
- Momentum indicators show a neutral stance with a potential for a reversal.
- Volatility has been decreasing, indicating a possible period of consolidation.
- Volume indicators reflect indecision and selling pressure in the market.
Conclusion:
Based on the analysis of the technical indicators, the next few days for COLB could see sideways movement with a slight bullish bias. Traders should exercise caution as the momentum indicators hint at a potential reversal, while the volume indicators suggest selling pressure. The decreasing volatility may lead to a period of consolidation before a clear direction is established. It is advisable to closely monitor key support and resistance levels for potential entry or exit points.
In summary, while the trend remains bullish, the overall market dynamics indicate a need for vigilance and a wait-and-see approach.