Technical Analysis of CPOP 2024-05-10
Overview:
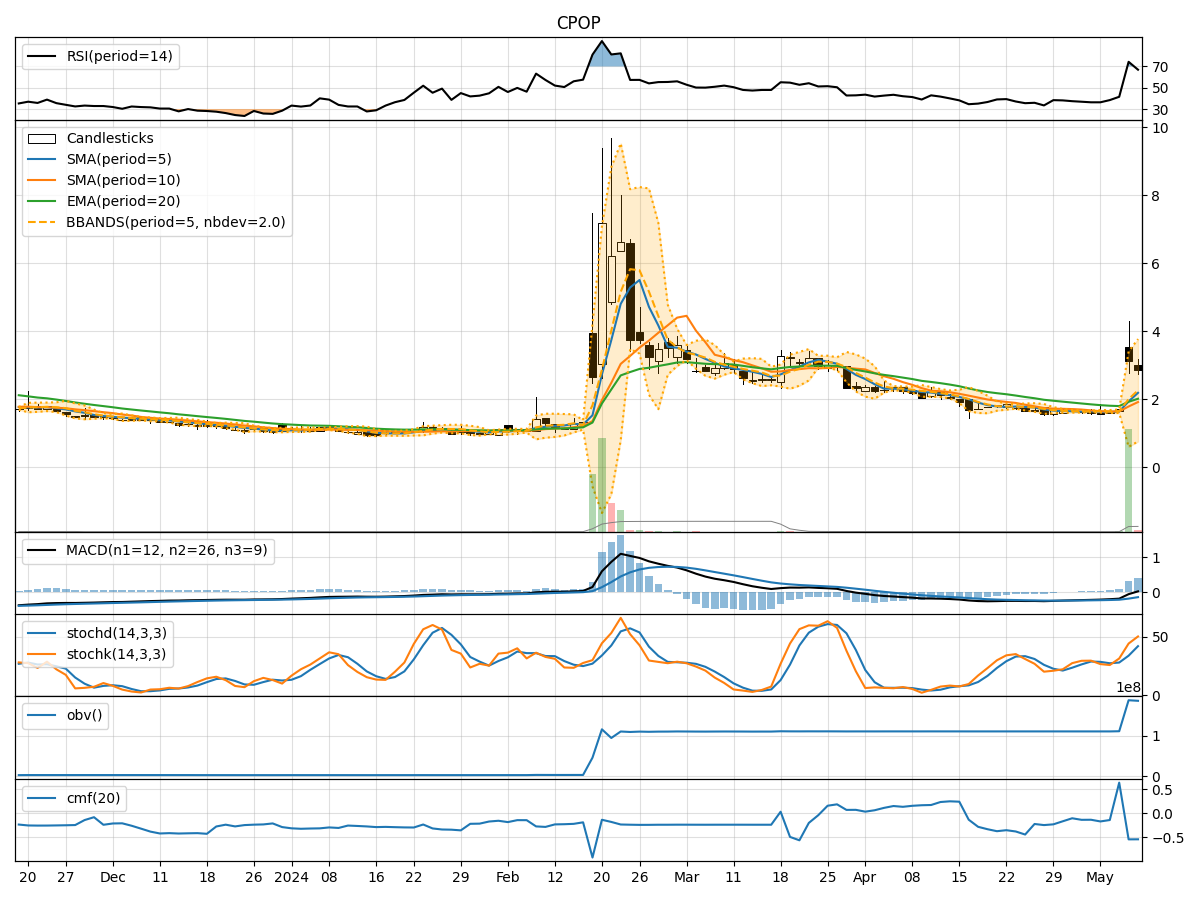
In analyzing the technical indicators for CPOP over the last 5 days, we will delve into the trend, momentum, volatility, and volume indicators to provide a comprehensive assessment of the stock's potential price movement. By examining these key factors, we aim to offer insights and predictions for the next few days.
Trend Indicators:
- Moving Averages (MA): The 5-day MA has been fluctuating, indicating some volatility in the short term. The stock price has been moving above and below the MA, suggesting indecision in the market.
- MACD: The MACD has been negative, indicating a bearish trend. However, the MACD histogram has been showing signs of improvement, moving towards the zero line.
- EMA: The EMA has been declining, reflecting a bearish sentiment in the stock.
Momentum Indicators:
- RSI: The RSI has been fluctuating between oversold and neutral levels, indicating a lack of strong momentum in either direction.
- Stochastic Oscillator: The stochastic indicators have been mixed, with the %K line showing some bullish momentum but the %D line lagging behind.
- Williams %R: The Williams %R has been hovering in the oversold territory, suggesting a potential reversal in the stock price.
Volatility Indicators:
- Bollinger Bands: The Bollinger Bands have widened significantly, indicating increased volatility in the stock price. The recent price spike has caused the bands to expand, signaling a potential reversal or continuation of the current trend.
- Volatility Percentage: The volatility percentage has been high, reflecting the recent price fluctuations and uncertainty in the market.
Volume Indicators:
- On-Balance Volume (OBV): The OBV has been fluctuating, indicating mixed buying and selling pressure in the stock.
- Chaikin Money Flow (CMF): The CMF has been negative, suggesting that money flow has been predominantly out of the stock over the past few days.
Key Observations:
- The stock has experienced significant price fluctuations and increased volatility over the last few days.
- Momentum indicators show mixed signals, with no clear direction in the stock's momentum.
- Volume indicators suggest a lack of strong buying interest, as reflected in the negative CMF.
Conclusion:
Based on the analysis of the technical indicators, the stock is currently bearish with increased volatility. The lack of strong momentum and mixed signals from the indicators indicate a period of uncertainty and potential consolidation in the stock price. Traders should exercise caution and wait for clearer signals before making any significant trading decisions.