Technical Analysis of CRESY 2024-05-10
Overview:
In analyzing the technical indicators for CRESY over the last 5 days, we will delve into the trends, momentum, volatility, and volume indicators to provide a comprehensive outlook on the possible stock price movement in the coming days. By examining these key aspects, we aim to offer valuable insights and recommendations for potential investors.
Trend Analysis:
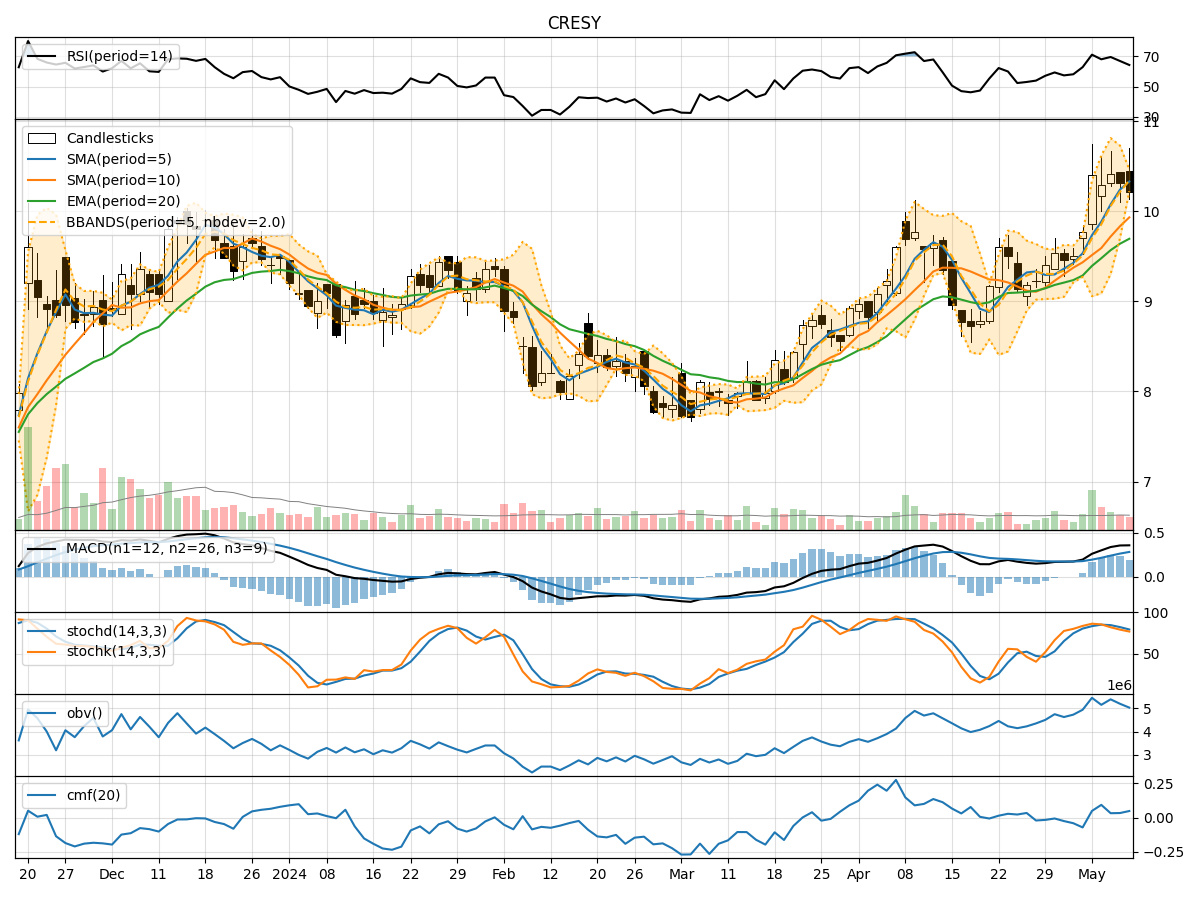
- Moving Averages (MA): The 5-day MA has been consistently above the 10-day SMA, indicating a short-term bullish trend.
- MACD: The MACD line has been above the signal line, suggesting a positive momentum in the stock price.
Key Observation: The trend indicators point towards a bullish sentiment in the stock price movement.
Momentum Analysis:
- RSI: The RSI values have been decreasing, indicating a slight weakening of the buying momentum.
- Stochastic Oscillator: Both %K and %D values have been declining, signaling a potential shift towards oversold conditions.
Key Observation: The momentum indicators suggest a slight bearish sentiment in the stock price momentum.
Volatility Analysis:
- Bollinger Bands (BB): The stock price has been trading within the bands, with the %B indicator hovering around the middle, indicating moderate volatility.
Key Observation: The volatility indicators suggest a sideways movement in the stock price with no significant breakout.
Volume Analysis:
- On-Balance Volume (OBV): The OBV values have been fluctuating, indicating mixed buying and selling pressure.
- Chaikin Money Flow (CMF): The CMF values have been relatively low, suggesting a lack of strong buying or selling momentum.
Key Observation: The volume indicators reflect a neutral sentiment with no clear direction in buying or selling pressure.
Conclusion:
Based on the analysis of the technical indicators, the overall outlook for CRESY in the next few days leans towards a sideways movement with a slight bearish bias in momentum. While the trend indicators signal a bullish sentiment, the weakening momentum and lack of significant volume support indicate a potential consolidation phase or a minor pullback in the stock price.
Recommendation: It is advisable to closely monitor the stock price movement for any signs of a breakout or reversal in the current trend. Investors should exercise caution and wait for more clarity in the market dynamics before making any significant trading decisions.
Disclaimer:
The analysis provided is based on historical data and technical indicators, and it is essential to consider other fundamental factors and market dynamics before making investment decisions. Consulting with a financial advisor for personalized guidance tailored to individual investment goals and risk tolerance is highly recommended.