Technical Analysis of CREV 2024-05-10
Overview:
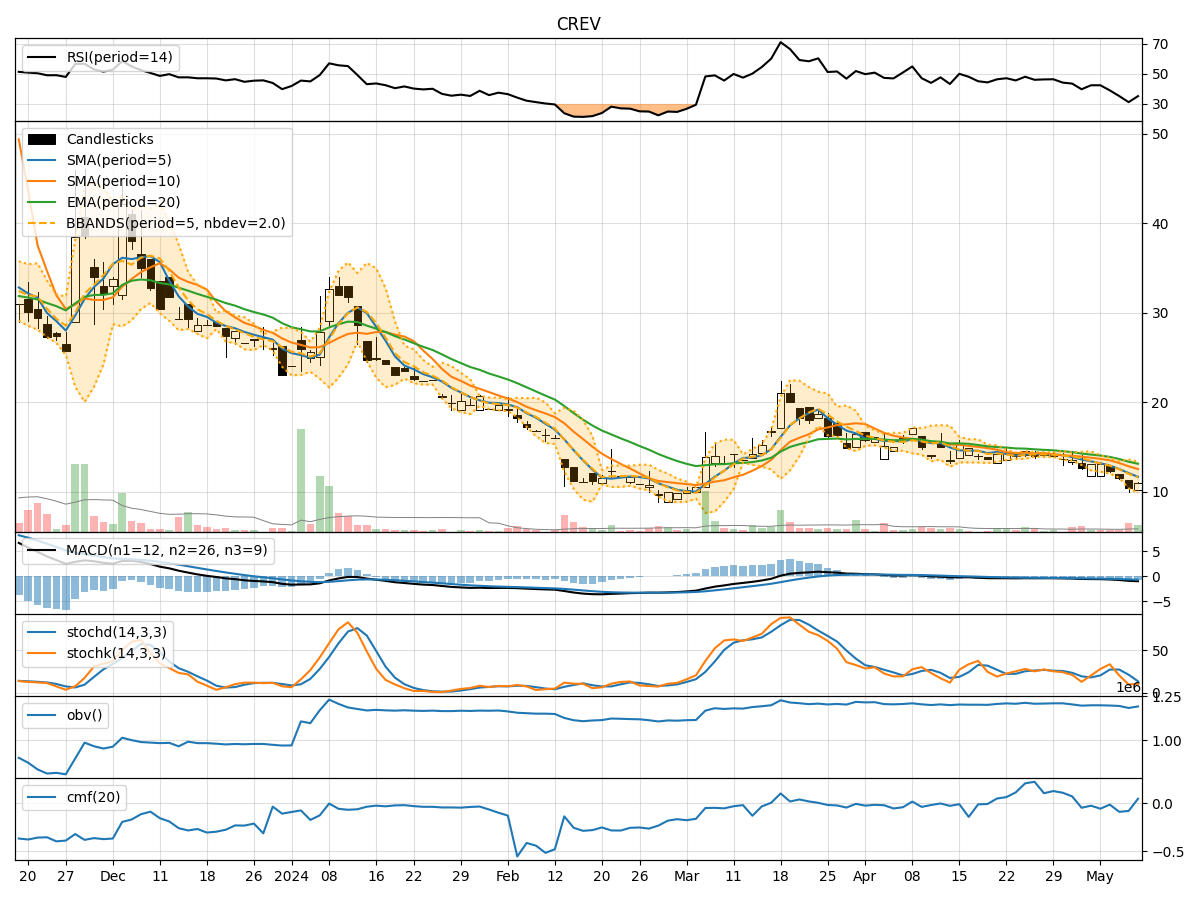
In analyzing the technical indicators for CREV stock over the last 5 days, we will delve into the trends, momentum, volatility, and volume aspects to provide a comprehensive outlook on the possible stock price movement in the coming days. By examining key indicators such as moving averages, MACD, RSI, Bollinger Bands, and OBV, we aim to offer valuable insights and predictions for informed decision-making.
Trend Analysis:
- Moving Averages (MA): The 5-day MA has been consistently below the closing prices, indicating a downward trend.
- MACD: The MACD line has been below the signal line, with negative values, suggesting bearish momentum.
Momentum Analysis:
- RSI: The RSI values have been decreasing, indicating weakening momentum.
- Stochastic Oscillator: Both %K and %D values have been declining, signaling a bearish momentum.
Volatility Analysis:
- Bollinger Bands (BB): The stock price has been consistently below the middle Bollinger Band, indicating a downtrend.
Volume Analysis:
- On-Balance Volume (OBV): The OBV values have been decreasing, suggesting selling pressure.
Key Observations:
- The stock is in a clear downtrend based on moving averages and MACD.
- Momentum indicators like RSI and Stochastic Oscillator point towards weakening momentum.
- Volatility indicators show the stock is trading below the middle Bollinger Band, indicating a bearish sentiment.
- The declining OBV values suggest increased selling pressure.
Conclusion:
Based on the analysis of the technical indicators, the next few days for CREV stock are likely to see a continuation of the downward trend. The momentum is bearish, and selling pressure is evident from the volume indicators. Therefore, it is advisable to exercise caution and consider potential short-selling or wait for a clear reversal signal before considering long positions. Downward movement is expected in the near term.