Technical Analysis of CRNT 2024-05-10
Overview:
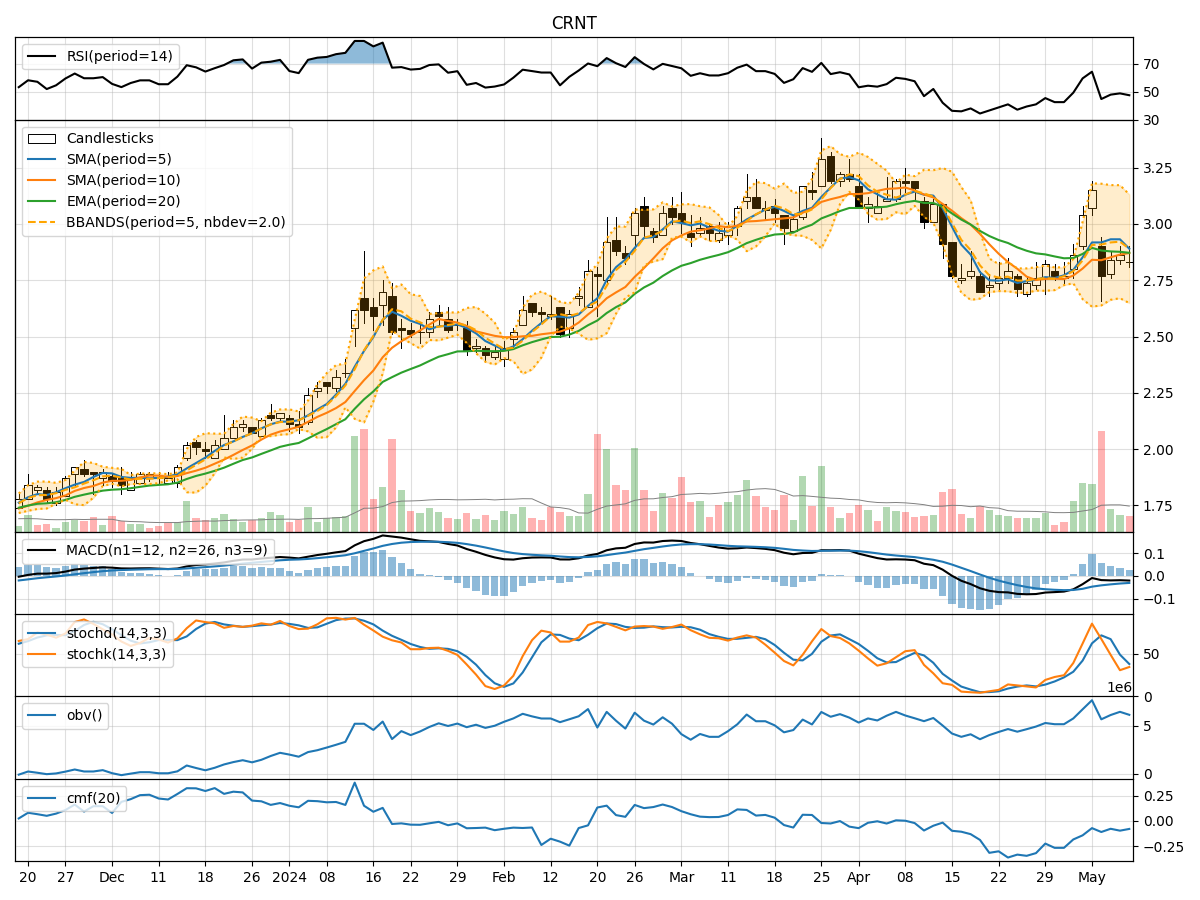
In analyzing the technical indicators for CRNT over the last 5 days, we will delve into the trend, momentum, volatility, and volume indicators to provide a comprehensive assessment of the stock's potential price movement. By examining these key factors, we aim to offer valuable insights and predictions for the next few days.
Trend Analysis:
- Moving Averages (MA): The 5-day MA has been fluctuating around the 10-day SMA, indicating a lack of clear trend direction.
- MACD: The MACD line has been consistently below the signal line, suggesting a bearish momentum in the short term.
- EMA: The EMA has been declining slightly, reflecting a weakening trend.
Momentum Analysis:
- RSI: The RSI has been oscillating around the 50 level, indicating a neutral momentum.
- Stochastic Oscillator: Both %K and %D have been in the oversold region, signaling a potential reversal.
- Williams %R: The Williams %R has been hovering in the oversold territory, suggesting a possible buying opportunity.
Volatility Analysis:
- Bollinger Bands (BB): The stock price has been trading within the lower Bollinger Band, indicating a period of low volatility.
- BB Width: The Bollinger Band width has been narrowing, suggesting a potential breakout or significant price movement ahead.
Volume Analysis:
- On-Balance Volume (OBV): The OBV has shown mixed signals, with fluctuations in volume accumulation.
- Chaikin Money Flow (CMF): The CMF has been negative, indicating selling pressure in the market.
Key Observations:
- The stock is currently in a consolidation phase with no clear trend direction.
- Momentum indicators suggest a potential reversal in the oversold region.
- Volatility is low, but the narrowing Bollinger Bands indicate an impending breakout.
- Volume indicators show mixed signals, reflecting uncertainty in market participation.
Conclusion:
Based on the analysis of technical indicators, the next few days for CRNT could see sideways movement with a potential bullish bias. Traders should closely monitor the stochastic oscillator and Williams %R for signs of a reversal. Additionally, keep an eye on the Bollinger Bands for a breakout signal. Overall, a cautious approach with a focus on key support and resistance levels is recommended in the current market environment.