Technical Analysis of CRUS 2024-05-31
Overview:
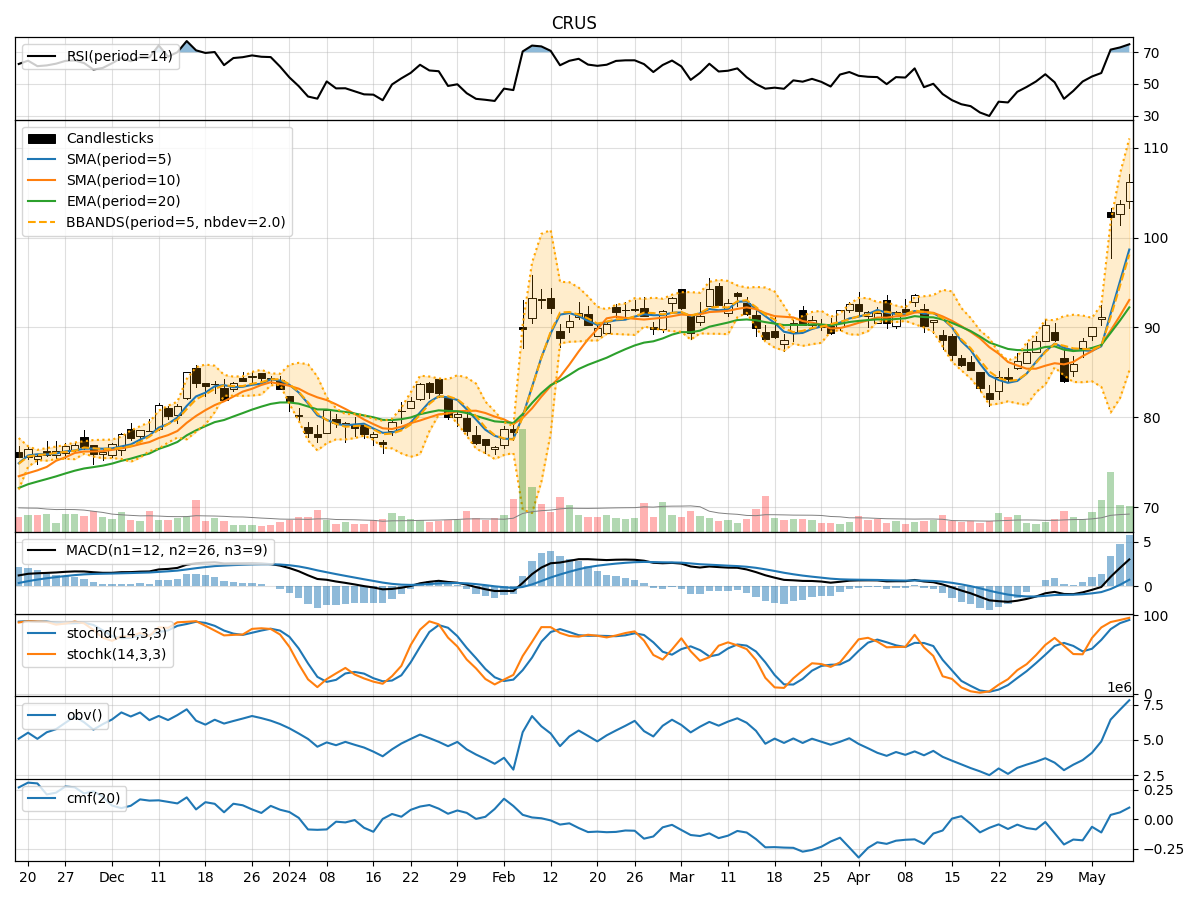
In analyzing the technical indicators for CRUS over the last 5 days, we will delve into the trend, momentum, volatility, and volume indicators to provide a comprehensive outlook on the possible stock price movement in the coming days.
Trend Indicators:
- Moving Averages (MA): The 5-day MA has been consistently above the closing price, indicating a short-term uptrend. Both the SMA(10) and EMA(20) have shown an upward trajectory, suggesting a bullish sentiment in the mid to long term.
- MACD: The MACD line has been above the signal line, indicating bullish momentum. The MACD histogram has been positive, further supporting the bullish trend.
Momentum Indicators:
- RSI: The RSI has been in the overbought territory, suggesting a potential reversal or consolidation in the stock price.
- Stochastic Oscillator: Both %K and %D have been decreasing, indicating a potential bearish momentum. The stock might be overbought and due for a correction.
- Williams %R: The indicator has been in the oversold region, signaling a potential reversal to the upside.
Volatility Indicators:
- Bollinger Bands: The stock price has been trading within the bands, indicating a period of consolidation. The bands have not shown significant expansion or contraction, suggesting stable volatility.
- Bollinger %B: The %B indicator has been hovering around 0.5, indicating a neutral stance in terms of volatility.
Volume Indicators:
- On-Balance Volume (OBV): The OBV has shown a slight decrease, suggesting some distribution happening in the stock. This could be an early indication of a potential trend reversal.
- Chaikin Money Flow (CMF): The CMF has been positive, indicating buying pressure in the stock. However, the recent decrease in CMF might signal a weakening of buying momentum.
Conclusion:
Based on the analysis of the technical indicators, the stock price of CRUS is likely to experience a short-term correction or consolidation in the coming days. The overbought conditions indicated by RSI and stochastic oscillators, coupled with the potential distribution shown in OBV, suggest a possible downward movement in the stock price. Traders should exercise caution and consider taking profits or implementing risk management strategies in anticipation of a potential pullback.