Technical Analysis of CSLM 2024-05-31
Overview:
In analyzing the technical indicators for CSLM over the last 5 days, we will delve into the trend, momentum, volatility, and volume indicators to provide a comprehensive outlook on the possible stock price movement in the coming days. By examining these key indicators, we aim to offer valuable insights and predictions to guide your investment decisions.
Trend Indicators:
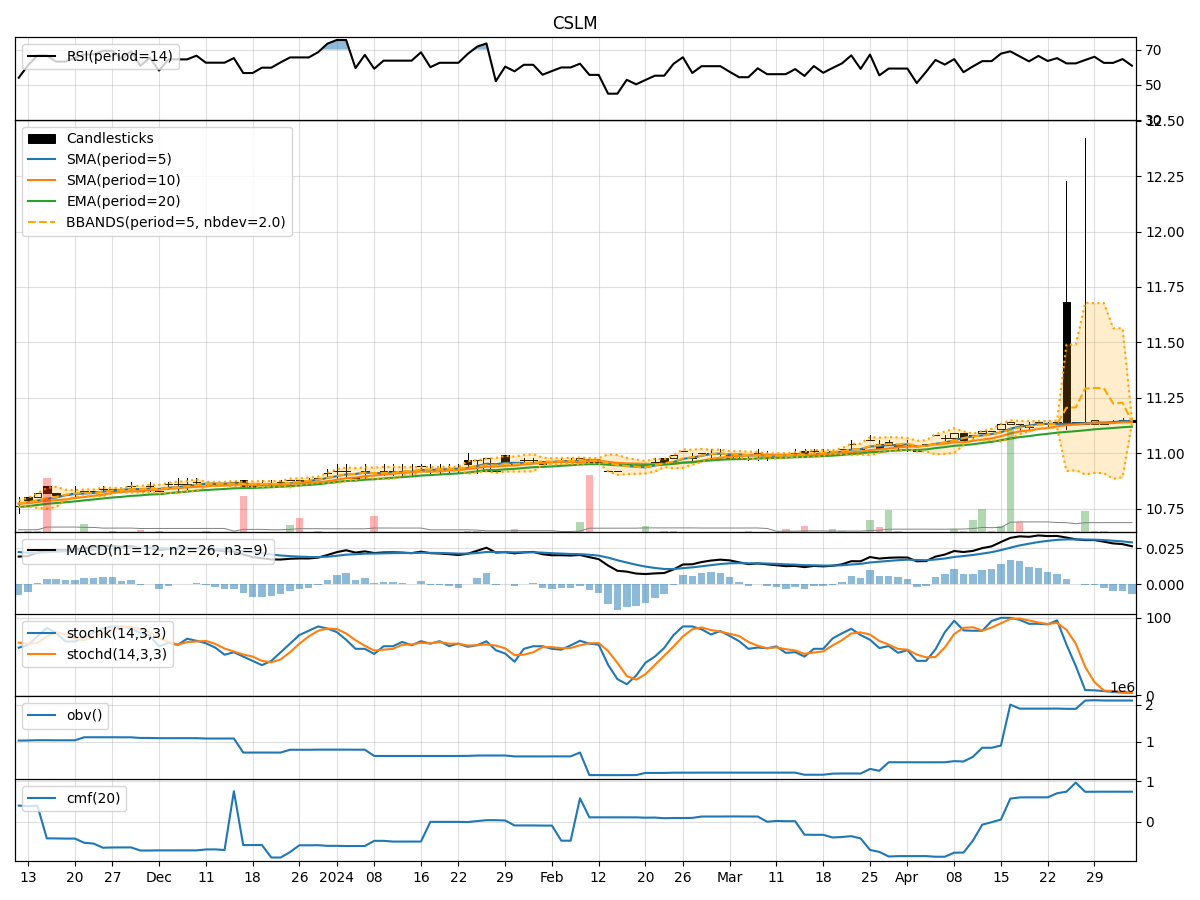
- Moving Averages (MA): The moving averages have been showing a slight upward trend, with the 5-day moving average consistently above the 10-day simple moving average. This indicates a positive momentum in the short term.
- MACD (Moving Average Convergence Divergence): The MACD and signal line have been trending upwards, with the MACD histogram also showing an increasing trend. This suggests a strengthening bullish momentum in the stock.
Momentum Indicators:
- RSI (Relative Strength Index): The RSI has been hovering around the 60-70 range, indicating a moderate level of buying pressure. It has not reached overbought levels, suggesting potential room for further upside.
- Stochastic Oscillator: Both %K and %D lines of the Stochastic Oscillator have been rising steadily, reaching near overbought levels. This indicates increasing buying momentum in the stock.
Volatility Indicators:
- Bollinger Bands (BB): The Bollinger Bands have been widening slightly, indicating increased volatility in the stock price. The price has been fluctuating within the bands, suggesting potential price swings in the near term.
Volume Indicators:
- On-Balance Volume (OBV): The OBV has been relatively flat, indicating a balance between buying and selling pressure. This suggests a neutral sentiment among investors.
- Chaikin Money Flow (CMF): The CMF has been negative, indicating that money is flowing out of the stock. This could be a cause for concern regarding the stock's price movement.
Key Observations:
- The trend indicators suggest a bullish sentiment in the short term, supported by the moving averages and MACD.
- Momentum indicators show increasing buying pressure, as indicated by the RSI and Stochastic Oscillator.
- Volatility indicators point towards potential price swings due to increased volatility.
- Volume indicators reflect a neutral sentiment with a slight outflow of money, as shown by the OBV and CMF.
Conclusion:
Based on the analysis of the technical indicators, the stock is likely to experience further upward movement in the coming days. The bullish trend supported by the moving averages and MACD, coupled with increasing buying momentum indicated by the RSI and Stochastic Oscillator, suggests a positive outlook for CSLM. However, investors should remain cautious of potential price swings due to increased volatility. Overall, the stock is currently in a bullish phase and is expected to continue its upward trajectory in the near term.