Technical Analysis of CTAS 2024-05-10
Overview:
In analyzing the technical indicators for CTAS over the last 5 days, we will delve into the trends, momentum, volatility, and volume aspects to provide a comprehensive outlook on the possible stock price movement. By examining these key indicators, we aim to offer valuable insights and predictions for the upcoming days.
Trend Analysis:
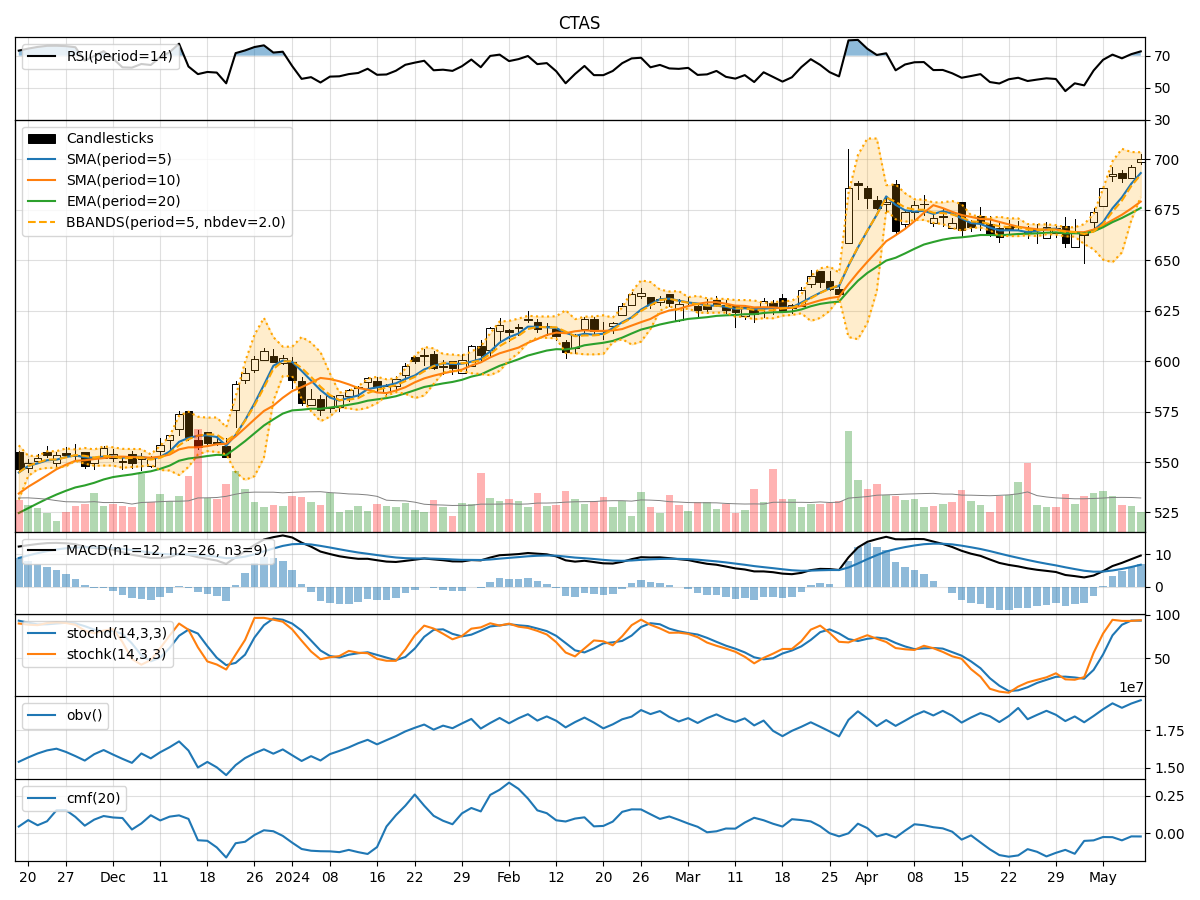
- Moving Averages (MA): The 5-day Moving Average (MA) has been consistently rising, indicating a bullish trend in the short term.
- MACD: The MACD line has been increasing, surpassing the signal line, suggesting a strengthening bullish momentum.
Momentum Analysis:
- RSI: The Relative Strength Index (RSI) has been trending upwards, reaching overbought levels, signaling a potential pullback.
- Stochastic Oscillator: Both %K and %D have been in the overbought zone, indicating a possible reversal in the short term.
Volatility Analysis:
- Bollinger Bands (BB): The stock price has been trading near the upper Bollinger Band, suggesting an overbought condition.
Volume Analysis:
- On-Balance Volume (OBV): The OBV has been fluctuating, indicating indecision among investors.
- Chaikin Money Flow (CMF): The CMF has been negative, reflecting selling pressure in the market.
Key Observations:
- The trend indicators show a strong bullish sentiment in the short term.
- Momentum indicators suggest a potential pullback due to overbought conditions.
- Volatility indicators point towards an overbought market.
- Volume indicators indicate a lack of strong buying interest.
Conclusion:
Based on the analysis of technical indicators, the stock price of CTAS is likely to experience a short-term pullback or consolidation in the upcoming days. The overbought conditions indicated by momentum and volatility indicators, coupled with the lack of strong buying volume, suggest a potential reversal in the short term. Traders may consider taking profits or waiting for a better entry point before considering long positions.