Technical Analysis of CTSH 2024-05-10
Overview:
In analyzing the technical indicators for CTSH over the last 5 days, we will delve into the trend, momentum, volatility, and volume indicators to provide a comprehensive outlook on the possible stock price movement. By examining these key factors, we aim to offer valuable insights and predictions for the upcoming days.
Trend Indicators:
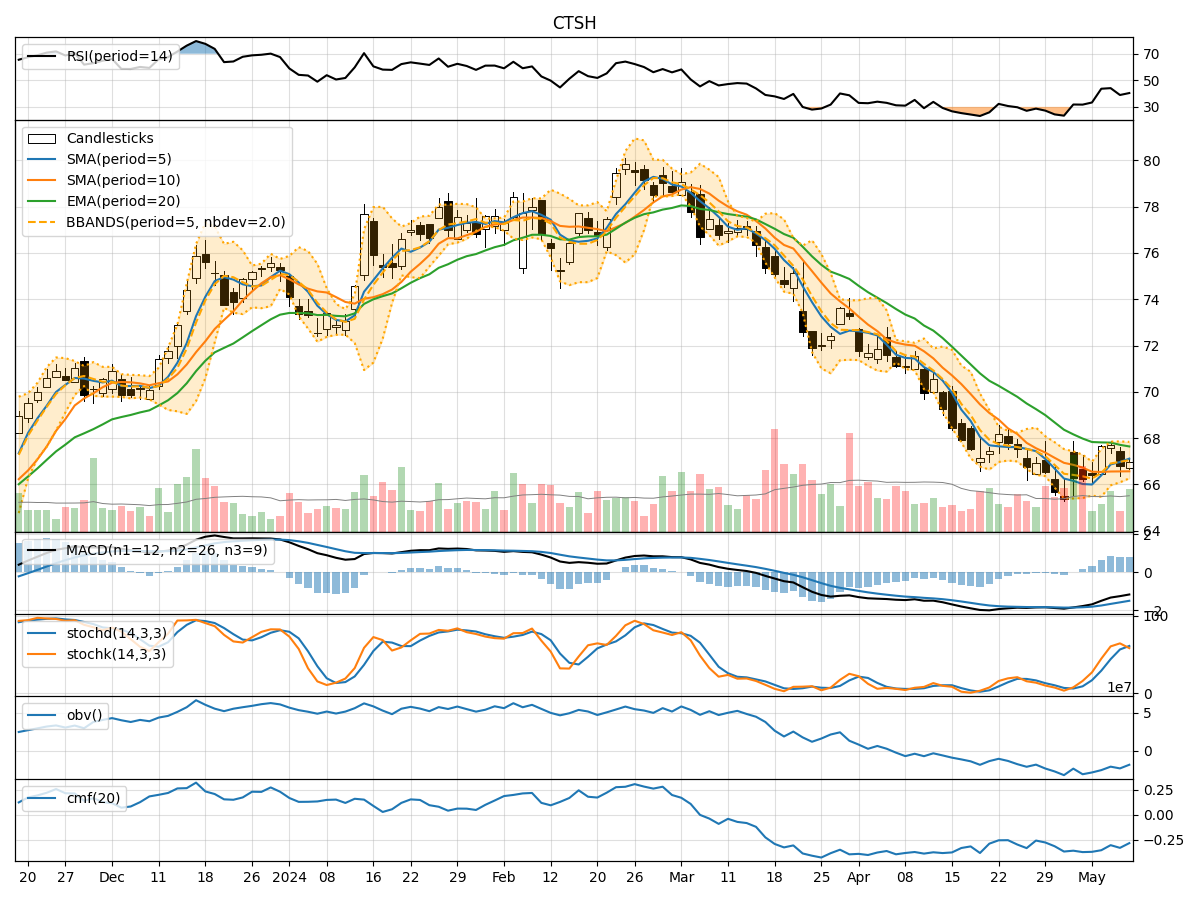
- Moving Averages (MA): The 5-day MA has been showing an upward trend, indicating a positive momentum in the short term.
- MACD: The MACD line has been consistently below the signal line, suggesting a bearish trend in the stock price movement.
- EMA: The EMA has been gradually declining, indicating a weakening trend in the stock price.
Momentum Indicators:
- RSI: The RSI has been fluctuating within the neutral zone, indicating a lack of strong momentum in either direction.
- Stochastic Oscillator: The stochastic indicators have been oscillating within the overbought and oversold levels, suggesting a mixed sentiment among traders.
- Williams %R: The Williams %R has been hovering around the oversold territory, indicating a potential reversal in the stock price.
Volatility Indicators:
- Bollinger Bands (BB): The Bollinger Bands have been narrowing, indicating decreasing volatility in the stock price.
- BB% (Bollinger Band %B): The %B has been fluctuating within a tight range, suggesting a period of consolidation in the stock price.
Volume Indicators:
- On-Balance Volume (OBV): The OBV has been showing a slight decline, indicating a decrease in buying pressure.
- Chaikin Money Flow (CMF): The CMF has been negative, suggesting a lack of strong inflow of money into the stock.
Conclusion:
Based on the analysis of the technical indicators, the stock of CTSH is currently exhibiting a mixed outlook. The trend indicators show a slightly positive short-term momentum, while the momentum indicators suggest a lack of strong directional bias. The volatility indicators point towards a period of consolidation, with decreasing volatility in the stock price. The volume indicators indicate a decrease in buying pressure and a lack of strong inflow of money into the stock.
Overall Assessment:
- Direction: The stock is currently in a sideways consolidation phase with no clear trend direction.
- Recommendation: It is advisable to closely monitor the stock for any breakout or breakdown from the consolidation range before making any trading decisions.
- Risk: The lack of strong momentum and volume support increases the risk of false breakouts or breakdowns.
- Caution: Exercise caution and wait for more definitive signals before taking any significant trading positions.
Key Takeaway:
Given the current technical indicators and market dynamics, it is crucial to remain patient and vigilant for potential shifts in the stock price movement. Stay informed and be prepared to act decisively based on confirmed signals to capitalize on any emerging opportunities.