Technical Analysis of CVAC 2024-05-10
Overview:
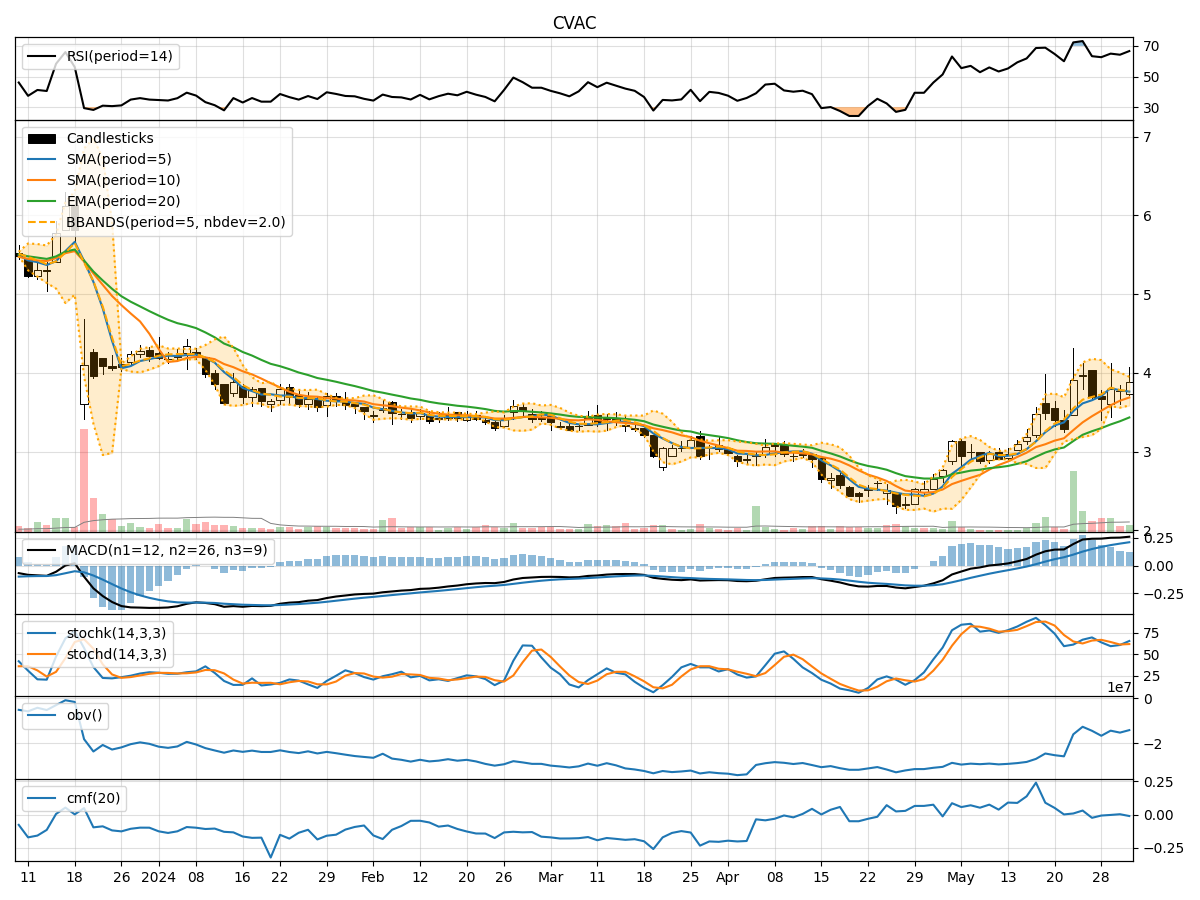
In analyzing the technical indicators for CVAC over the last 5 days, we will delve into the trend, momentum, volatility, and volume indicators to provide a comprehensive outlook on the possible stock price movement in the coming days. By examining these key indicators, we aim to offer valuable insights and predictions for potential investors.
Trend Indicators:
- Moving Averages (MA): The 5-day Moving Average (MA) has been fluctuating around the closing prices, indicating short-term price trends. The Simple Moving Average (SMA) and Exponential Moving Average (EMA) show a gradual increase over the period.
- MACD: The Moving Average Convergence Divergence (MACD) has been positive, with the MACD line consistently above the signal line, suggesting bullish momentum.
- Conclusion: The trend indicators suggest an upward trend in the stock price.
Momentum Indicators:
- RSI: The Relative Strength Index (RSI) has been oscillating around the 50 level, indicating a balanced momentum between buying and selling pressure.
- Stochastic Oscillator: Both %K and %D have been in the overbought region, suggesting a potential reversal in price direction.
- Conclusion: The momentum indicators imply a neutral stance in the short term.
Volatility Indicators:
- Bollinger Bands (BB): The Bollinger Bands have been narrowing, indicating decreasing volatility and a potential price breakout in the near future.
- Conclusion: Volatility is decreasing, signaling a possible consolidation phase ahead.
Volume Indicators:
- On-Balance Volume (OBV): The OBV has been fluctuating, indicating mixed buying and selling pressure.
- Chaikin Money Flow (CMF): The CMF has been positive, suggesting a net inflow of money into the stock.
- Conclusion: Volume indicators show a mixed sentiment among investors.
Overall Conclusion:
Based on the analysis of the technical indicators, the stock of CVAC is likely to experience a consolidation phase in the coming days, with a potential for a slight upward bias in price. Traders should monitor the narrowing Bollinger Bands for a breakout signal, while also keeping an eye on the Stochastic Oscillator for a possible reversal. The mixed volume indicators indicate a cautious approach, and investors may consider waiting for clearer signals before making significant trading decisions.
In summary, the stock of CVAC is expected to consolidate in the short term, with a slight upward bias. It is advisable for investors to exercise patience and monitor key technical levels for potential entry or exit points.