Technical Analysis of DCBO 2024-05-10
Overview:
In analyzing the technical indicators for DCBO stock over the last 5 days, we will delve into the trend, momentum, volatility, and volume indicators to provide a comprehensive outlook on the possible stock price movement in the coming days. By examining these key indicators, we aim to offer valuable insights and predictions for potential investors and traders.
Trend Indicators:
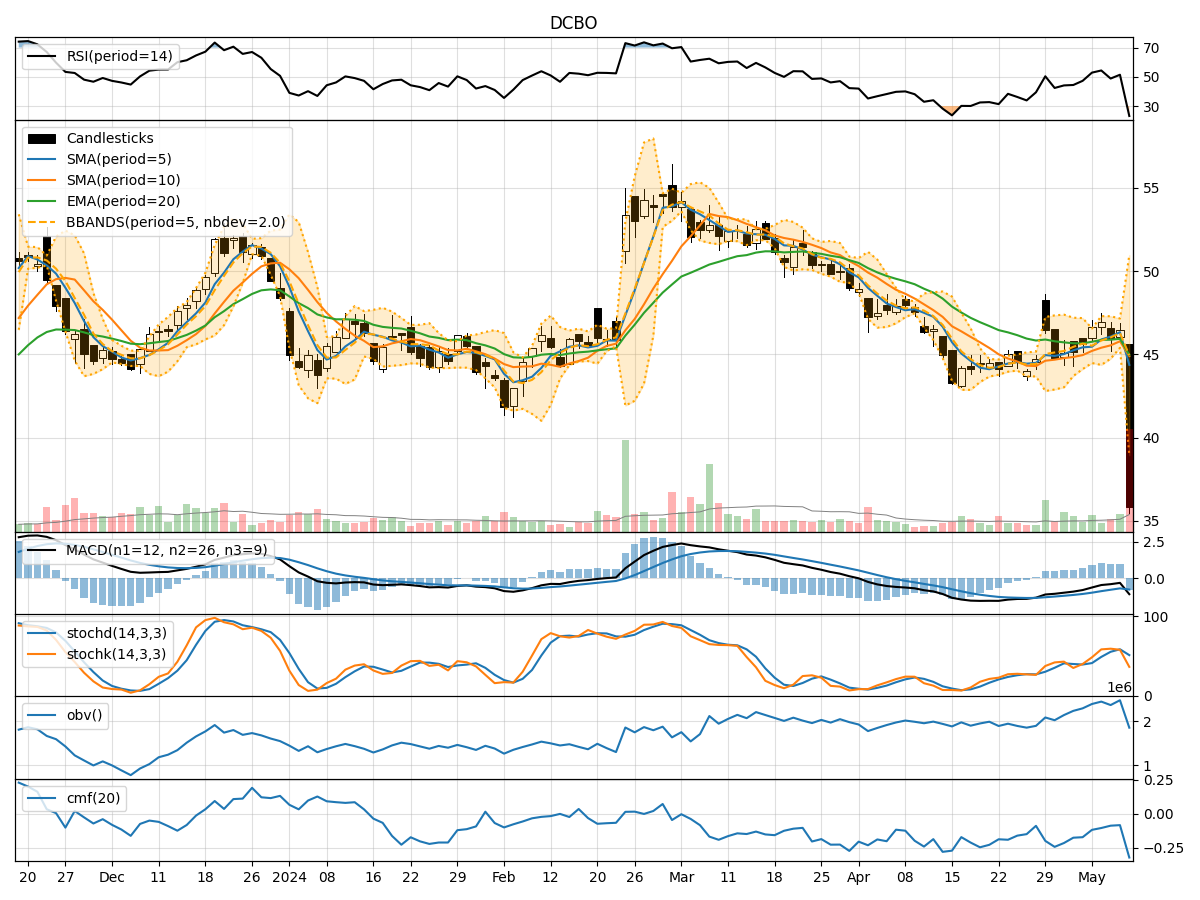
- Moving Averages (MA): The 5-day moving average has been fluctuating, indicating some volatility in the short term.
- MACD: The MACD line has been negative, suggesting a bearish trend in the stock price movement.
- EMA: The exponential moving average has been relatively stable but slightly declining.
Key Observation: The trend indicators point towards a bearish sentiment in the stock price movement.
Momentum Indicators:
- RSI: The Relative Strength Index has been fluctuating around the neutral zone, indicating indecision in the market.
- Stochastic Oscillator: Both %K and %D have been showing mixed signals, with %K below %D, suggesting a potential reversal.
- Williams %R: The Williams %R is in oversold territory, indicating a possible buying opportunity.
Key Observation: The momentum indicators suggest a mixed sentiment with a slight bullish bias.
Volatility Indicators:
- Bollinger Bands: The stock price has breached the lower Bollinger Band, indicating oversold conditions.
- Bollinger %B: The %B is close to 0, suggesting a potential reversal or bounce back.
- Average True Range (ATR): The ATR has spiked, indicating increased volatility in the stock.
Key Observation: Volatility indicators signal oversold conditions and the potential for a reversal.
Volume Indicators:
- On-Balance Volume (OBV): The OBV has been declining, indicating selling pressure in the stock.
- Chaikin Money Flow (CMF): The CMF is negative, suggesting outflow of money from the stock.
Key Observation: Volume indicators point towards bearish sentiment and selling pressure.
Conclusion:
Based on the analysis of the technical indicators, the stock is currently in an oversold condition with bearish trend indicators. However, the momentum indicators show a slight bullish bias, indicating a potential reversal or bounce back in the stock price. The volatility indicators suggest a possible turnaround, while the volume indicators signal selling pressure.
Overall Assessment:
- Short-Term Outlook: The stock may experience a short-term bounce back or consolidation.
- Medium- to Long-Term Outlook: The bearish trend could persist if the stock fails to sustain any potential reversal.
Recommendation:
- Short-Term Traders: Consider monitoring for a potential bounce back or reversal signal.
- Long-Term Investors: Exercise caution and wait for more definitive signals before considering entry or exit positions.
Key Conclusion:
- The stock is currently in an oversold condition with mixed signals, suggesting a potential short-term bounce back but a bearish medium- to long-term outlook.
Final Verdict:
- Short-Term: Potential for a bounce back.
- Medium- to Long-Term: Bearish sentiment prevails.
By carefully considering the interplay of these technical indicators, investors can make more informed decisions aligned with their risk tolerance and investment goals.