Technical Analysis of DIST 2024-05-10
Overview:
In analyzing the technical indicators for the stock of DIST over the last 5 days, we will delve into the trend, momentum, volatility, and volume indicators to provide a comprehensive assessment of the possible stock price movement in the coming days. By examining these key indicators, we aim to offer valuable insights and recommendations for potential investors.
Trend Analysis:
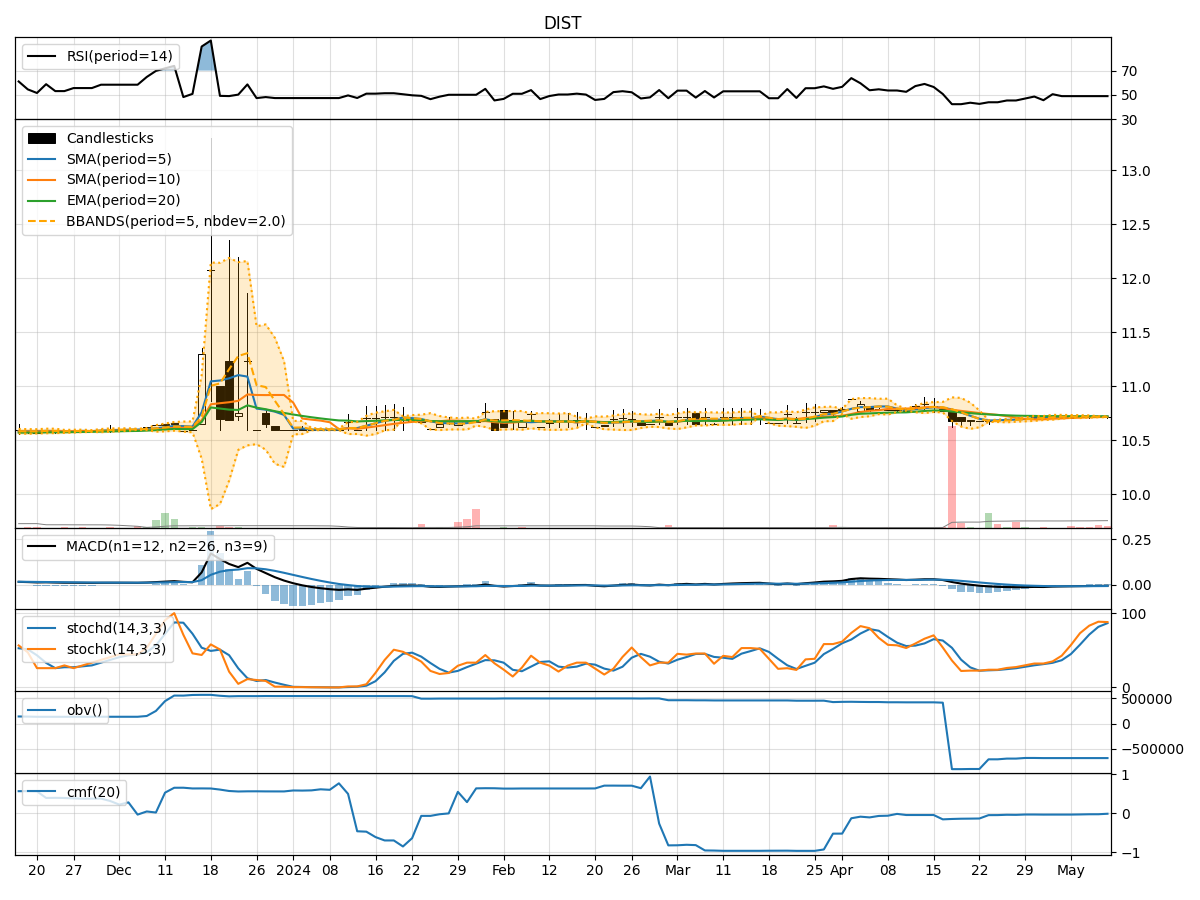
- Moving Averages (MA): The 5-day Moving Average has been relatively stable at around 10.72, indicating a consistent price level.
- MACD: The MACD line has been negative, suggesting a bearish trend in the short term.
- RSI: The Relative Strength Index (RSI) at 48.73 indicates a neutral sentiment without any extreme overbought or oversold conditions.
Momentum Analysis:
- Stochastic Oscillator: The Stochastic Oscillator shows values above 80, indicating an overbought condition in the recent days.
- Williams %R: The Williams %R also indicates an oversold condition, potentially signaling a reversal in the near future.
Volatility Analysis:
- Bollinger Bands: The Bollinger Bands have narrowed, indicating decreased volatility and a potential period of consolidation.
- Volatility Percentage (BBP): The BBP at 1.0 suggests that the stock price is currently at the upper Bollinger Band, potentially indicating a short-term overbought condition.
Volume Analysis:
- On-Balance Volume (OBV): The OBV has remained relatively flat, suggesting a lack of significant buying or selling pressure.
- Chaikin Money Flow (CMF): The CMF at negative values indicates a bearish money flow trend in the short term.
Conclusion:
Based on the analysis of the technical indicators, the stock of DIST is currently exhibiting mixed signals. The trend indicators suggest a neutral to slightly bearish outlook, while the momentum indicators show conflicting signals of overbought and oversold conditions. The volatility indicators point towards a period of consolidation with decreased volatility, and the volume indicators indicate a lack of significant buying or selling pressure.
Key Observations:
- Trend: The trend is relatively stable but slightly bearish.
- Momentum: Conflicting signals of overbought and oversold conditions.
- Volatility: Decreased volatility and potential consolidation phase.
- Volume: Lack of significant buying or selling pressure.
Overall Assessment:
The stock of DIST is likely to experience sideways movement in the coming days, with a potential for consolidation as indicated by the narrowing Bollinger Bands and lack of significant volume activity. Investors should exercise caution and closely monitor the price action for any signs of a clear trend reversal before making any trading decisions.