Technical Analysis of DKNG 2024-05-10
Overview:
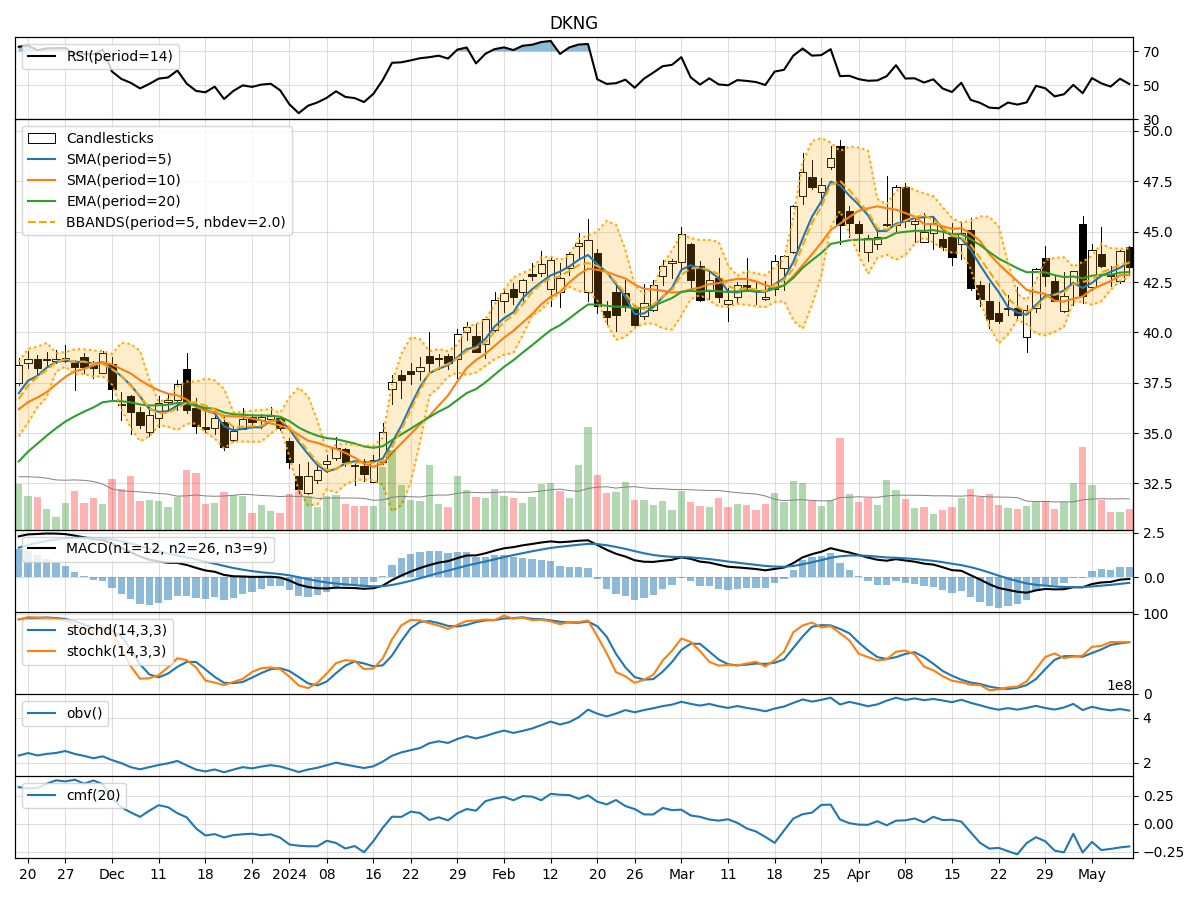
In analyzing the technical indicators for DKNG over the last 5 days, we will delve into the trend, momentum, volatility, and volume indicators to provide a comprehensive outlook on the possible stock price movement. By examining these key indicators, we aim to offer valuable insights and predictions for the upcoming days.
Trend Analysis:
- Moving Averages (MA): The 5-day Moving Average (MA) has been consistently above the closing prices, indicating a short-term uptrend.
- MACD: The Moving Average Convergence Divergence (MACD) has shown negative values but with a slight convergence, suggesting a potential reversal in the downtrend.
- EMA: The Exponential Moving Average (EMA) has been relatively stable, reflecting a neutral trend.
Momentum Analysis:
- RSI: The Relative Strength Index (RSI) has been fluctuating around the mid-level, indicating indecision in the market.
- Stochastic Oscillator: Both %K and %D have been hovering in the overbought territory, signaling a potential reversal or consolidation.
- Williams %R: The Williams %R is in the oversold region, suggesting a possible buying opportunity.
Volatility Analysis:
- Bollinger Bands (BB): The Bollinger Bands have shown narrowing bands, indicating decreasing volatility and a potential price breakout.
- BB% (Bollinger Band %B): The %B indicator is below 1, suggesting the price is trading below the lower band, potentially oversold.
Volume Analysis:
- On-Balance Volume (OBV): The OBV has been fluctuating, indicating mixed buying and selling pressure.
- Chaikin Money Flow (CMF): The CMF has been negative, reflecting outflow of money from the stock.
Key Observations and Opinions:
- Trend: The trend indicators suggest a neutral to slightly bullish outlook in the short term.
- Momentum: Momentum indicators show mixed signals, with a potential for a reversal or consolidation.
- Volatility: Volatility is decreasing, indicating a possible period of consolidation before a breakout.
- Volume: Volume indicators reflect uncertainty in market participation and investor sentiment.
Conclusion:
Based on the analysis of the technical indicators, the next few days for DKNG could see sideways consolidation with a slight bullish bias. Traders should watch for a potential breakout above the upper Bollinger Band as a signal for a bullish continuation. However, it is essential to monitor key support and resistance levels for any trend reversal. Overall, a cautious approach with proper risk management is advisable in the current market environment.