Technical Analysis of DOCU 2024-05-10
Overview:
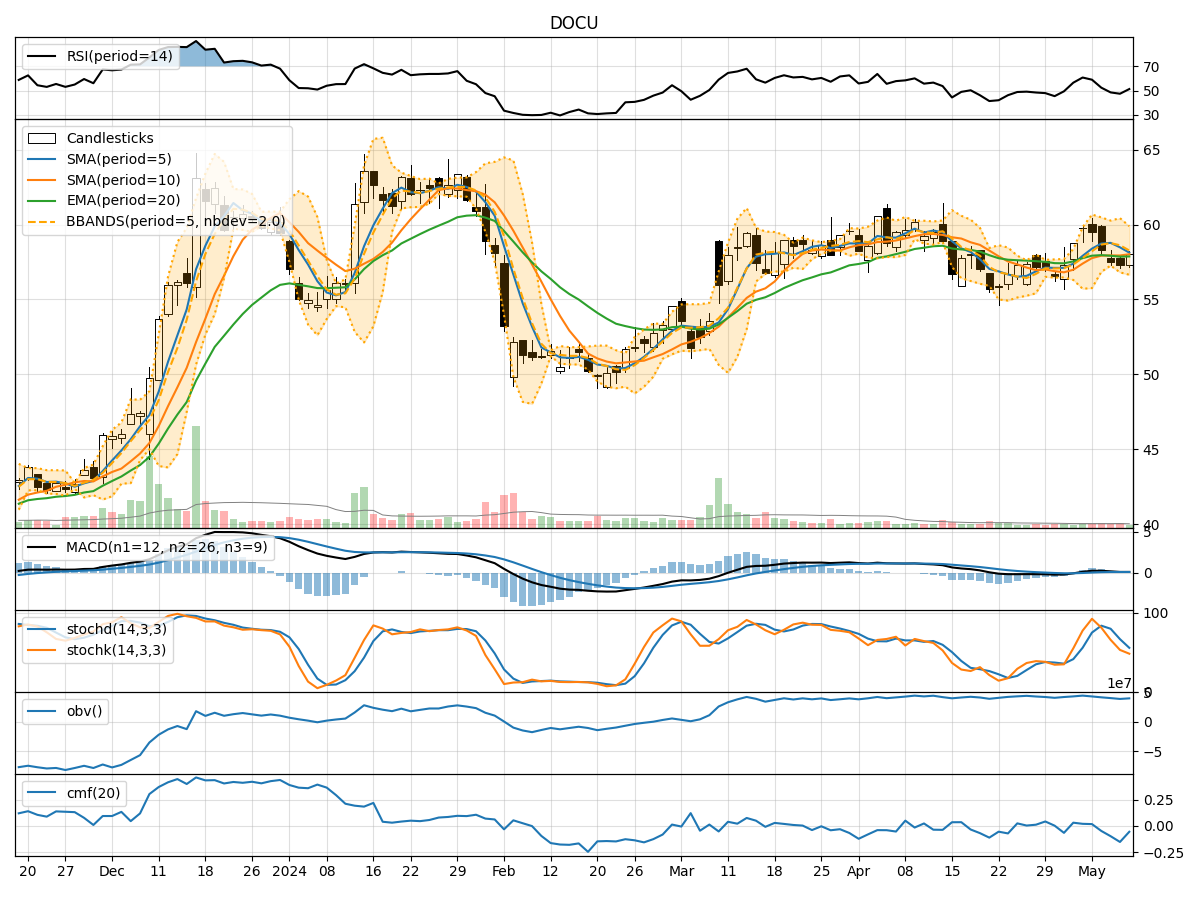
In the last 5 trading days, DOCU has shown a mixed performance with fluctuations in price and volume. The technical indicators across trend, momentum, volatility, and volume provide valuable insights into the stock's potential future movements. Let's analyze each category of indicators to determine the possible next few days' stock price movement.
Trend Indicators:
- Moving Averages (MA): The 5-day Moving Average (MA) has been fluctuating around the stock price, indicating short-term price trends. The Simple Moving Average (SMA) and Exponential Moving Average (EMA) show a slight upward trend.
- MACD: The Moving Average Convergence Divergence (MACD) and its signal line have been close to each other, suggesting a possible trend reversal.
- Conclusion: The trend indicators suggest a neutral to slightly bullish outlook for the stock.
Momentum Indicators:
- RSI: The Relative Strength Index (RSI) has been fluctuating but remains below overbought levels, indicating potential room for upward movement.
- Stochastic Oscillator: Both %K and %D have been declining, signaling a potential bearish momentum.
- Conclusion: The momentum indicators suggest a mixed outlook with a slight bearish bias.
Volatility Indicators:
- Bollinger Bands (BB): The Bollinger Bands have been narrowing, indicating decreasing volatility.
- Conclusion: The volatility indicators suggest a decreasing volatility environment.
Volume Indicators:
- On-Balance Volume (OBV): The OBV has been fluctuating, indicating mixed buying and selling pressure.
- Chaikin Money Flow (CMF): The CMF has been negative, suggesting a bearish money flow.
- Conclusion: The volume indicators suggest a mixed sentiment with a bearish money flow.
Key Observations:
- The trend indicators show a neutral to slightly bullish outlook.
- Momentum indicators indicate a mixed outlook with a slight bearish bias.
- Volatility indicators suggest decreasing volatility.
- Volume indicators reflect mixed sentiment with a bearish money flow.
Conclusion:
Based on the analysis of technical indicators, the next few days' possible stock price movement for DOCU is likely to be sideways with a slight bearish bias. Traders should exercise caution and closely monitor key support and resistance levels for potential entry or exit points. It is advisable to wait for more clarity in price action before making significant trading decisions.