Technical Analysis of DOOO 2024-05-10
Overview:
In analyzing the technical indicators for DOOO over the last 5 days, we will delve into the trend, momentum, volatility, and volume indicators to provide a comprehensive outlook on the possible stock price movement. By examining these key factors, we aim to offer valuable insights and predictions for the upcoming days.
Trend Analysis:
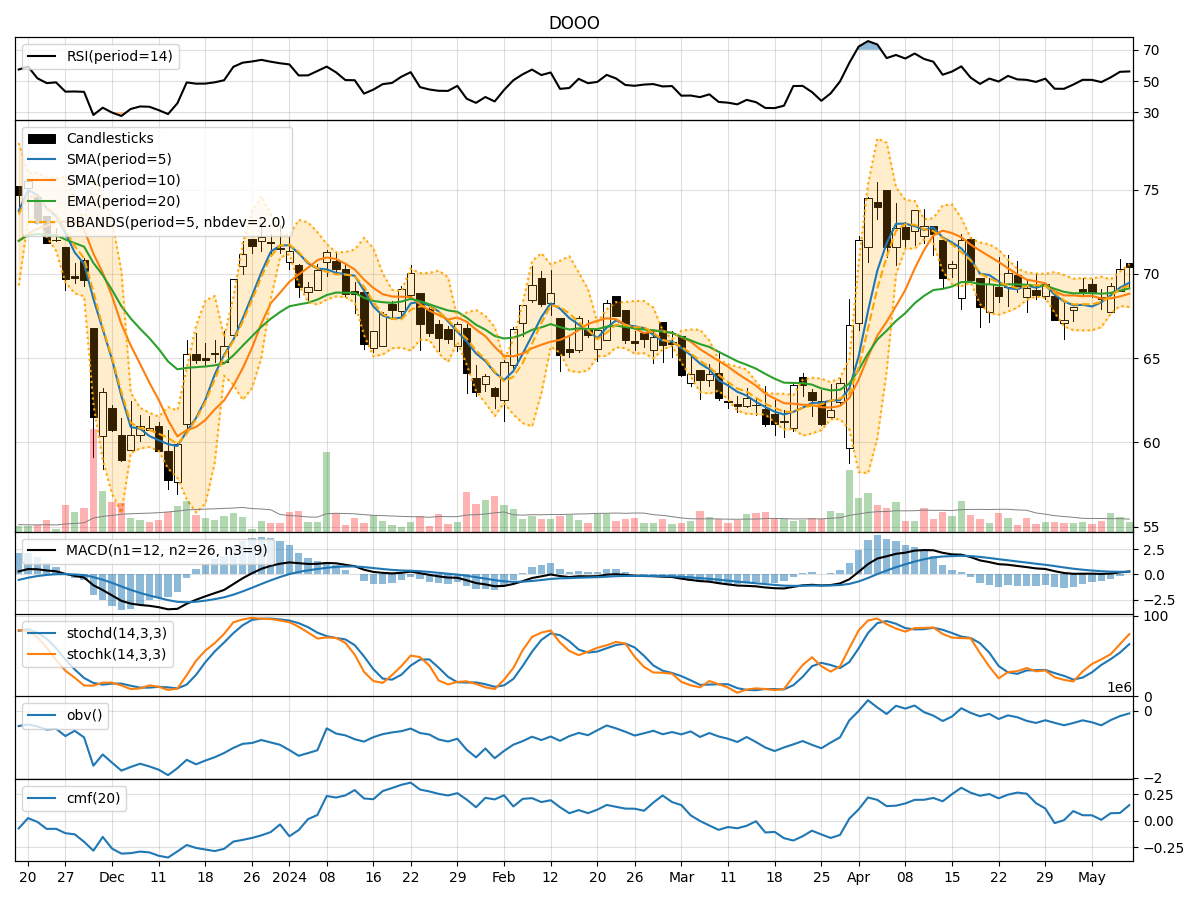
- Moving Averages (MA): The 5-day Moving Average (MA) has been trending upwards, indicating a positive momentum in the stock price.
- MACD: The MACD line has been consistently above the signal line, suggesting a bullish trend in the short term.
- EMA: The Exponential Moving Average (EMA) has been steadily increasing, supporting the bullish sentiment in the stock.
Key Observation: The trend indicators point towards a bullish outlook for DOOO in the short term.
Momentum Analysis:
- RSI: The Relative Strength Index (RSI) has been gradually increasing, indicating strengthening buying pressure.
- Stochastic Oscillator: Both %K and %D lines of the Stochastic Oscillator are in the overbought territory, suggesting a potential reversal or consolidation.
- Williams %R: The Williams %R is in the oversold region, signaling a possible buying opportunity.
Key Observation: The momentum indicators show mixed signals, with a potential for a short-term pullback or consolidation.
Volatility Analysis:
- Bollinger Bands: The Bollinger Bands are widening, indicating increased volatility in the stock price.
- Bollinger %B: The %B indicator is hovering around 0.8, suggesting that the stock is trading near the upper band.
Key Observation: The volatility indicators suggest a heightened level of price fluctuations in the near term.
Volume Analysis:
- On-Balance Volume (OBV): The OBV has been steadily increasing, reflecting strong buying volume in the stock.
- Chaikin Money Flow (CMF): The CMF is positive, indicating that money is flowing into the stock.
Key Observation: The volume indicators support the bullish sentiment, indicating strong buying interest in DOOO.
Conclusion:
Based on the analysis of the technical indicators, the next few days for DOOO are likely to see a continuation of the bullish trend. The trend indicators, supported by positive momentum and strong buying volume, suggest further upside potential in the stock price. However, given the overbought conditions in the Stochastic Oscillator, investors should be cautious of a possible short-term pullback or consolidation. Overall, the outlook for DOOO remains bullish in the near term.