Technical Analysis of DOX 2024-05-10
Overview:
In analyzing the technical indicators for DOX over the last 5 days, we will delve into the trend, momentum, volatility, and volume indicators to provide a comprehensive outlook on the possible stock price movement. By examining these key aspects, we aim to offer valuable insights and predictions for the upcoming days.
Trend Analysis:
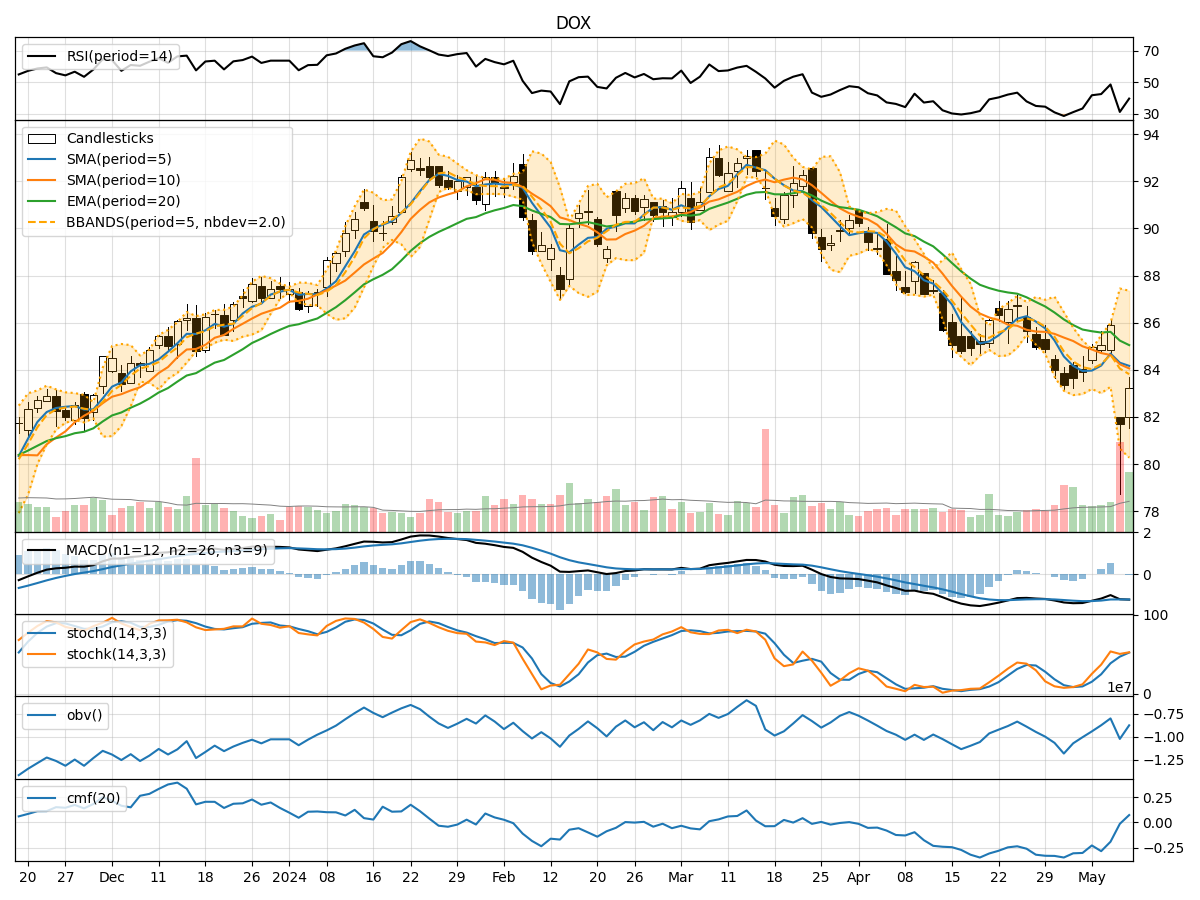
- Moving Averages (MA): The 5-day Moving Average (MA) has been fluctuating around the mid $84 range, indicating a relatively stable trend in the short term.
- MACD: The Moving Average Convergence Divergence (MACD) has been consistently negative, suggesting a bearish momentum in the stock price.
- EMA: The Exponential Moving Average (EMA) has been gradually declining, reflecting a downward trend in the stock price.
Momentum Analysis:
- RSI: The Relative Strength Index (RSI) has been hovering around the mid-30s to mid-40s, indicating a neutral to slightly bearish momentum.
- Stochastic Oscillator: The Stochastic Oscillator shows mixed signals, with the %K and %D lines fluctuating in the neutral zone.
- Williams %R: The Williams %R is in the oversold territory, suggesting a potential reversal or bounce in the stock price.
Volatility Analysis:
- Bollinger Bands: The Bollinger Bands have widened, indicating increased volatility in the stock price.
- Bollinger %B: The %B indicator is relatively low, suggesting the stock price is trading near the lower band of the Bollinger Bands.
Volume Analysis:
- On-Balance Volume (OBV): The OBV has shown mixed movements, reflecting indecision among market participants.
- Chaikin Money Flow (CMF): The CMF has been negative, indicating selling pressure in the stock.
Key Observations:
- The trend indicators suggest a bearish sentiment in the short term, with the MACD and EMA pointing towards a downward trajectory.
- Momentum indicators show a lack of strong momentum, with RSI and Stochastic Oscillator signaling a neutral stance.
- Volatility has increased, as seen in the widening Bollinger Bands, which may lead to larger price swings.
- Volume indicators reflect mixed signals, with OBV showing indecision and CMF indicating selling pressure.
Conclusion:
Based on the analysis of the technical indicators, the outlook for DOX in the next few days is bearish. The trend indicators, momentum signals, and volume analysis all point towards a potential downward movement in the stock price. Traders and investors should exercise caution and consider implementing risk management strategies in anticipation of a possible decline in DOX's stock price.