Technical Analysis of DRVN 2024-05-10
Overview:
In analyzing the technical indicators for DRVN over the last 5 days, we will delve into the trend, momentum, volatility, and volume indicators to provide a comprehensive outlook on the possible stock price movement. By examining these key aspects, we aim to offer valuable insights and predictions for the upcoming days.
Trend Analysis:
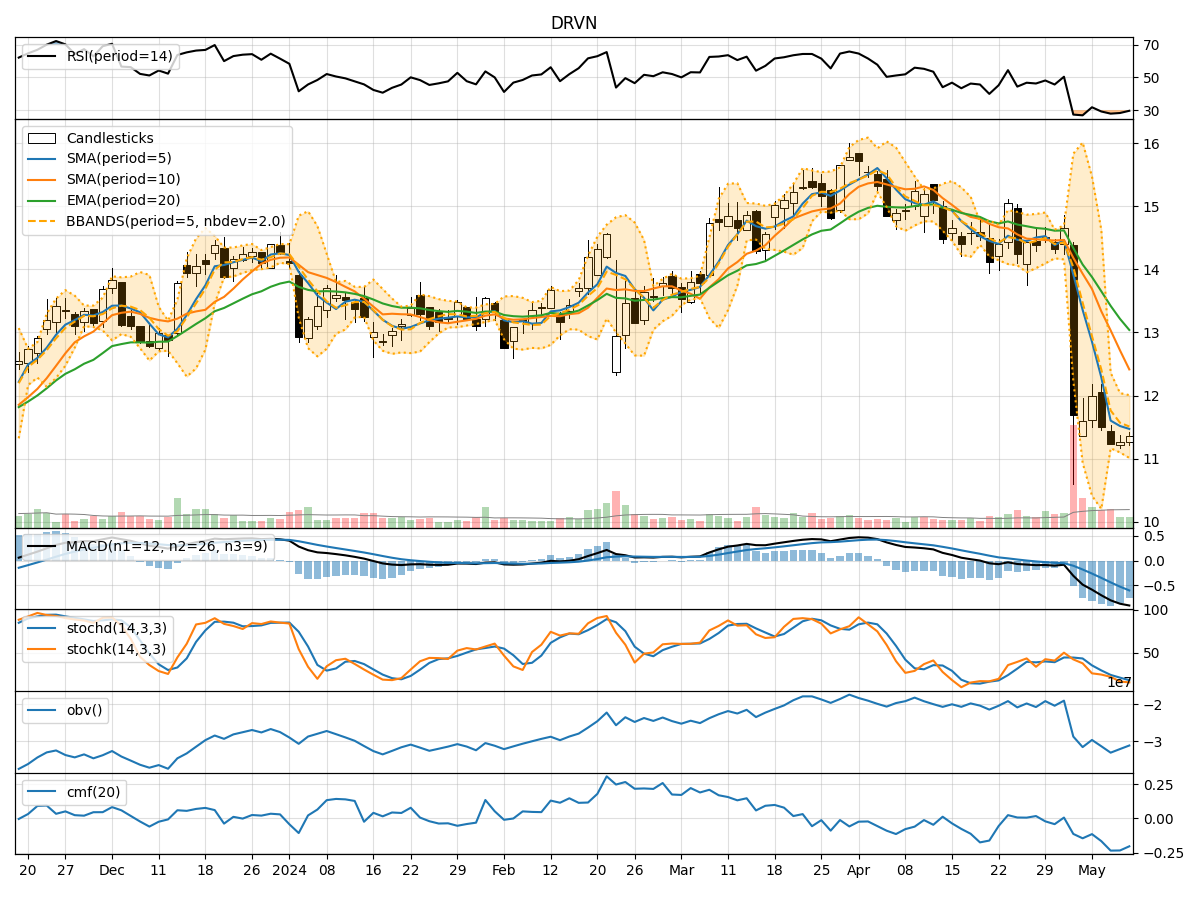
- Moving Averages (MA): The 5-day MA has been consistently below the closing price, indicating a downward trend.
- MACD: The MACD line has been negative, with the MACD histogram showing a decreasing trend, signaling bearish momentum.
- EMA: The EMA has been declining, further supporting the bearish trend.
Momentum Analysis:
- RSI: The RSI has been below 50, suggesting bearish momentum.
- Stochastic Oscillator: Both %K and %D have been decreasing, indicating a bearish sentiment.
- Williams %R: The indicator has been in oversold territory, reflecting a bearish outlook.
Volatility Analysis:
- Bollinger Bands (BB): The stock price has been consistently below the middle Bollinger Band, indicating a downward trend.
- Bollinger Band %B: The %B has been below 0.5, suggesting a bearish sentiment.
Volume Analysis:
- On-Balance Volume (OBV): The OBV has been negative, indicating selling pressure.
- Chaikin Money Flow (CMF): The CMF has been negative, reflecting a bearish trend in money flow.
Key Observations:
- The trend indicators, momentum oscillators, and volatility indicators all point towards a strong bearish sentiment in the stock.
- The volume indicators also support the bearish outlook, with selling pressure evident in the OBV and CMF.
Conclusion:
Based on the analysis of the technical indicators, DRVN is likely to experience further downward movement in the coming days. The bearish trend is well-supported by multiple indicators across trend, momentum, volatility, and volume categories. Traders and investors should exercise caution and consider shorting or avoiding long positions until there are clear signs of a trend reversal.