Technical Analysis of DTSS 2024-05-10
Overview:
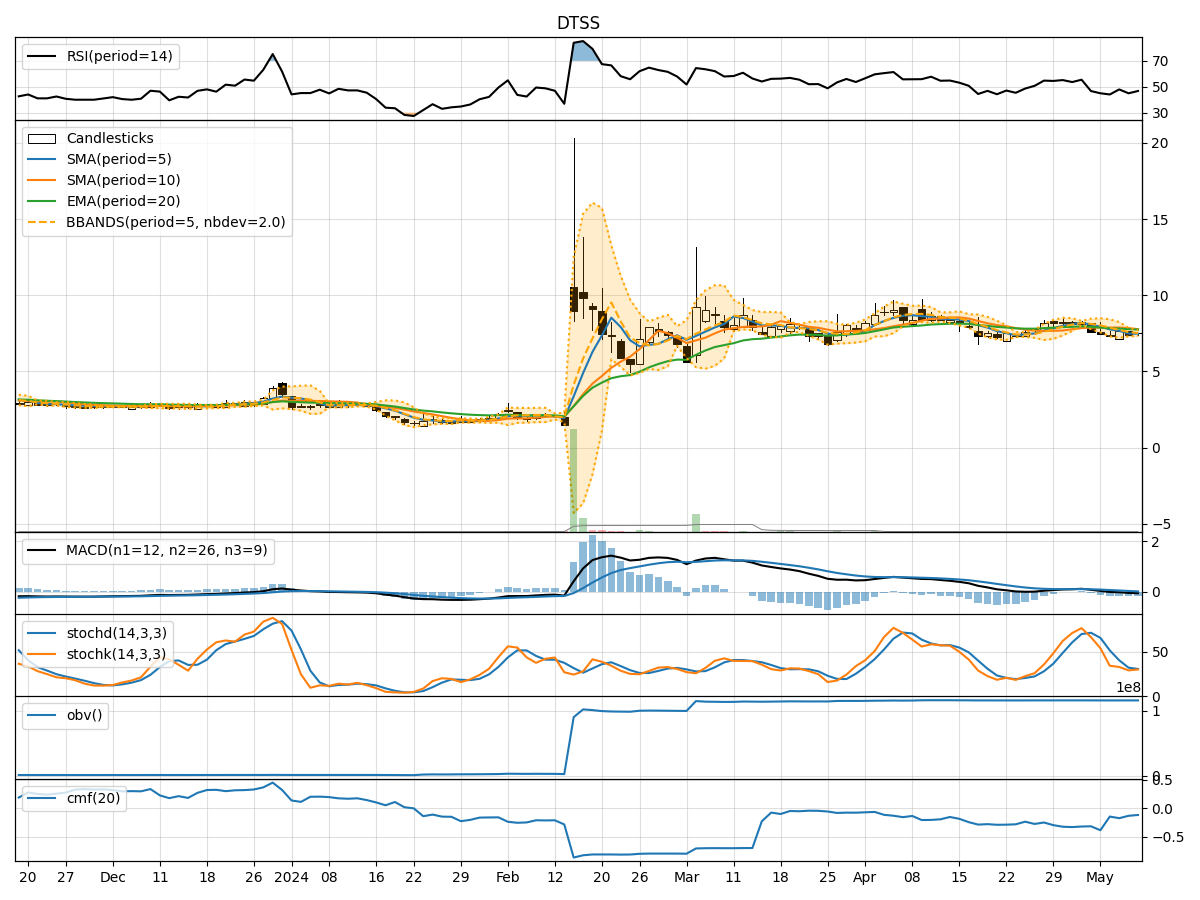
In analyzing the technical indicators for DTSS over the last 5 days, we will delve into the trend, momentum, volatility, and volume indicators to provide a comprehensive assessment of the stock's potential price movement. By examining these key factors, we aim to offer valuable insights and predictions for the next few days.
Trend Analysis:
- Moving Averages (MA): The 5-day Moving Average (MA) has been consistently below the Simple Moving Average (SMA) and Exponential Moving Average (EMA), indicating a downward trend.
- MACD: The MACD line has been below the signal line, with negative values for MACD Histogram (MACDH), suggesting bearish momentum.
Momentum Analysis:
- RSI: The Relative Strength Index (RSI) has been hovering around 45-50, indicating neutral momentum.
- Stochastic Oscillator: Both %K and %D have been below 50, signaling a bearish momentum.
- Williams %R: The Williams %R has been in oversold territory, suggesting a potential reversal.
Volatility Analysis:
- Bollinger Bands (BB): The stock price has been within the lower Bollinger Band, indicating potential oversold conditions.
- Bollinger %B: The %B indicator has been below 0.2, suggesting a possible bounce back.
Volume Analysis:
- On-Balance Volume (OBV): The OBV has been relatively stable, indicating a balance between buying and selling pressure.
- Chaikin Money Flow (CMF): The CMF has been negative, reflecting outflow of money from the stock.
Key Observations:
- The stock is currently in a downtrend based on moving averages and MACD.
- Momentum indicators suggest a bearish sentiment with potential for a reversal.
- Volatility indicators point towards oversold conditions.
- Volume indicators show a balance between buying and selling pressure.
Conclusion:
Based on the analysis of technical indicators, the stock is bearish in the short term. However, there are signs of potential reversal in momentum and volatility, indicating a possible upward movement in the next few days. Traders should closely monitor key levels and wait for confirmation of a trend reversal before considering long positions.