Technical Analysis of DUO 2024-05-10
Overview:
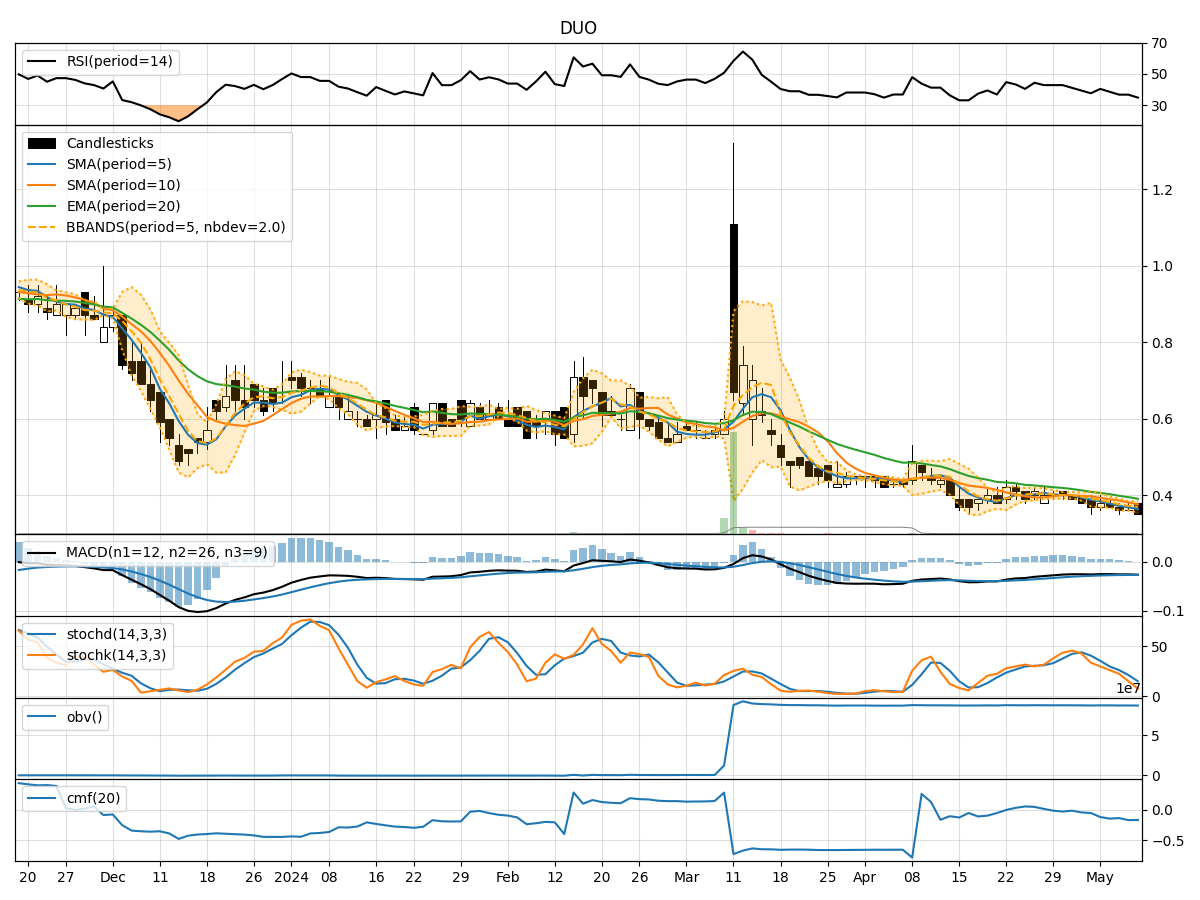
In analyzing the technical indicators for DUO over the last 5 days, we will delve into the trend, momentum, volatility, and volume indicators to provide a comprehensive outlook on the possible stock price movement. By examining these key aspects, we aim to offer valuable insights and predictions for the upcoming trading days.
Trend Analysis:
- Moving Averages (MA): The 5-day Moving Average (MA) has been consistently declining, indicating a downward trend in the stock price.
- MACD: The Moving Average Convergence Divergence (MACD) is also negative, suggesting bearish momentum in the short term.
- EMA: The Exponential Moving Average (EMA) is below the current price, further supporting a bearish outlook.
Momentum Analysis:
- RSI: The Relative Strength Index (RSI) is below 50, signifying a bearish momentum in the stock.
- Stochastic Oscillator: Both %K and %D are in oversold territory, indicating a potential reversal or continuation of the downtrend.
- Williams %R: The Williams %R is in the oversold region, suggesting a bearish sentiment.
Volatility Analysis:
- Bollinger Bands: The Bollinger Bands are narrowing, indicating decreasing volatility in the stock price.
- Bollinger %B: The %B is below 0.2, suggesting the stock is oversold.
- Bollinger Band Width: The Band Width is contracting, indicating a potential decrease in volatility.
Volume Analysis:
- On-Balance Volume (OBV): The OBV has been relatively stable, indicating no significant divergence between volume and price movements.
- Chaikin Money Flow (CMF): The CMF is negative, suggesting selling pressure in the stock.
Key Observations:
- The trend indicators, momentum oscillators, and volatility measures all point towards a bearish sentiment in the stock.
- The stock is currently in an oversold condition based on various indicators.
- The volume indicators do not show any significant divergence, supporting the current price trend.
Conclusion:
Based on the analysis of the technical indicators, the next few days are likely to see a continuation of the downward trend in DUO's stock price. Traders and investors should exercise caution as the stock is currently oversold, and a potential reversal or consolidation phase may occur in the near future. It is advisable to closely monitor key support levels and wait for confirmation of a trend reversal before considering any bullish positions.