Technical Analysis of DXCM 2024-05-10
Overview:
In analyzing the technical indicators for DXCM over the last 5 days, we will delve into the trend, momentum, volatility, and volume indicators to provide a comprehensive outlook on the possible stock price movement in the coming days. By examining these key aspects, we aim to offer valuable insights and predictions for investors looking to understand the market dynamics surrounding DXCM.
Trend Analysis:
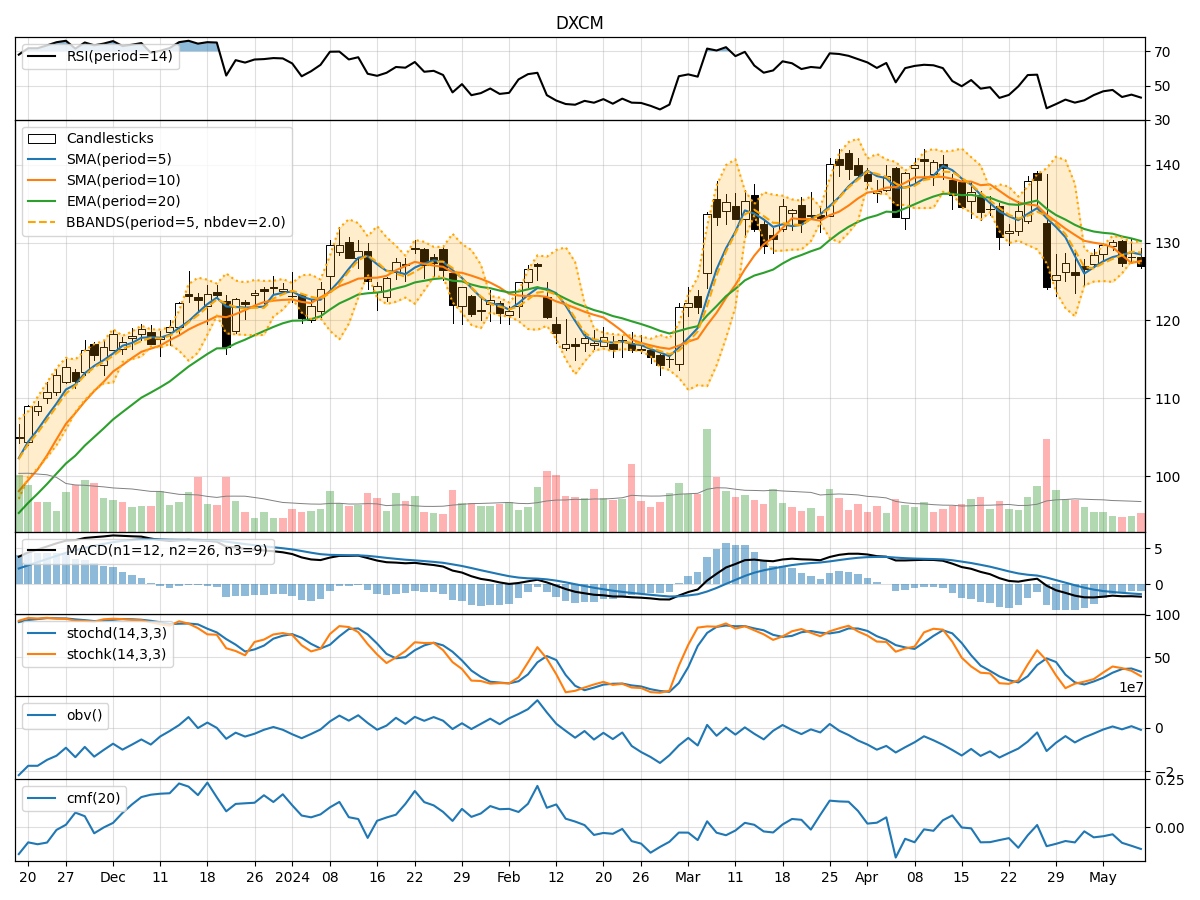
- Moving Averages (MA): The 5-day Moving Average (MA) has been fluctuating around the 127-128 range, indicating a relatively stable trend in the short term.
- MACD: The Moving Average Convergence Divergence (MACD) has been consistently negative, suggesting a bearish momentum in the stock price.
- EMA: The Exponential Moving Average (EMA) has been gradually declining, further supporting the bearish sentiment in the trend.
Momentum Analysis:
- RSI: The Relative Strength Index (RSI) has been hovering around the mid-40s, indicating a neutral momentum with no clear overbought or oversold conditions.
- Stochastic Oscillator: Both %K and %D of the Stochastic Oscillator have been trending downwards, signaling a weakening momentum in the stock price.
- Williams %R: The Williams %R is in the oversold territory, suggesting a potential reversal or bounce in the near future.
Volatility Analysis:
- Bollinger Bands: The Bollinger Bands have been narrowing, indicating decreasing volatility in the stock price.
- Bollinger %B: The %B indicator is relatively low, suggesting that the stock price is trading near the lower band of the Bollinger Bands.
Volume Analysis:
- On-Balance Volume (OBV): The OBV has been consistently negative, indicating a net selling pressure in the stock.
- Chaikin Money Flow (CMF): The CMF has been in the negative territory, reflecting a bearish money flow in the stock.
Key Observations and Opinions:
- Trend: The trend indicators point towards a bearish sentiment in the stock price, with the MACD and EMA showing consistent downward trends.
- Momentum: The momentum indicators suggest a weakening momentum, with the Stochastic Oscillator and Williams %R signaling potential oversold conditions.
- Volatility: The decreasing volatility indicated by the Bollinger Bands may lead to a period of consolidation or a potential breakout.
- Volume: The negative OBV and CMF indicate a bearish volume trend, further supporting the overall bearish outlook.
Conclusion:
Based on the analysis of the technical indicators, the next few days for DXCM are likely to see further downward movement in the stock price. The bearish trend, weakening momentum, and negative volume indicators all point towards a continuation of the current bearish sentiment. Investors should exercise caution and consider potential shorting opportunities or wait for a clear reversal signal before considering long positions.