Technical Analysis of EDAP 2024-05-10
Overview:
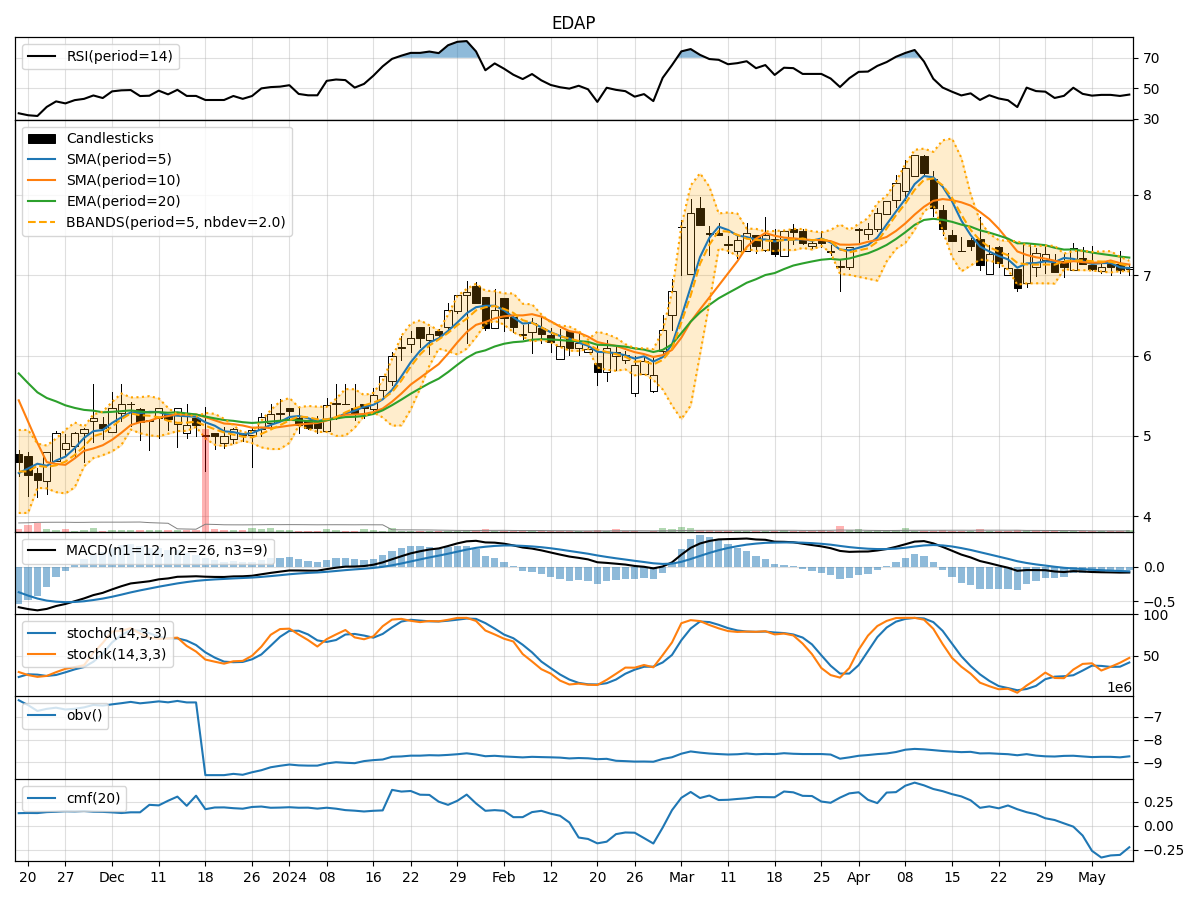
In analyzing the technical indicators for EDAP over the last 5 days, we will delve into the trend, momentum, volatility, and volume indicators to provide a comprehensive assessment of the stock's potential price movement. By examining these key factors, we aim to offer valuable insights and predictions for the next few days.
Trend Analysis:
- Moving Averages (MA): The 5-day MA has been consistently below the closing price, indicating a short-term downtrend.
- MACD: The MACD line has been decreasing, with the MACD histogram also showing a downward trend, suggesting weakening momentum.
Key Observation: The trend indicators point towards a downward movement in the stock price.
Momentum Analysis:
- RSI: The RSI values have been fluctuating around the 50 level, indicating a lack of strong momentum in either direction.
- Stochastic Oscillator: Both %K and %D values have been fluctuating, reflecting indecision in the market.
Key Observation: Momentum indicators suggest a sideways movement or consolidation in the stock price.
Volatility Analysis:
- Bollinger Bands (BB): The bands have been narrowing, indicating decreasing volatility in the stock price.
Key Observation: Volatility indicators signal a reduction in price fluctuations.
Volume Analysis:
- On-Balance Volume (OBV): The OBV values have been mixed, showing no clear trend in volume accumulation.
- Chaikin Money Flow (CMF): The CMF values have been negative, indicating selling pressure in the market.
Key Observation: Volume indicators suggest uncertainty in the stock's trading activity.
Conclusion:
Based on the analysis of the technical indicators, the next few days for EDAP are likely to see a downward movement in the stock price, supported by the trend indicators showing a bearish sentiment. However, the momentum indicators suggest a sideways movement or consolidation, indicating a lack of strong directional bias. The decreasing volatility and mixed volume signals further add to the uncertainty in the market.
Overall Assessment: The stock is likely to experience a bearish trend in the near term, with potential for sideways movement and reduced volatility. Traders should exercise caution and closely monitor key support and resistance levels for potential entry or exit points.