Technical Analysis of EEFT 2024-05-10
Overview:
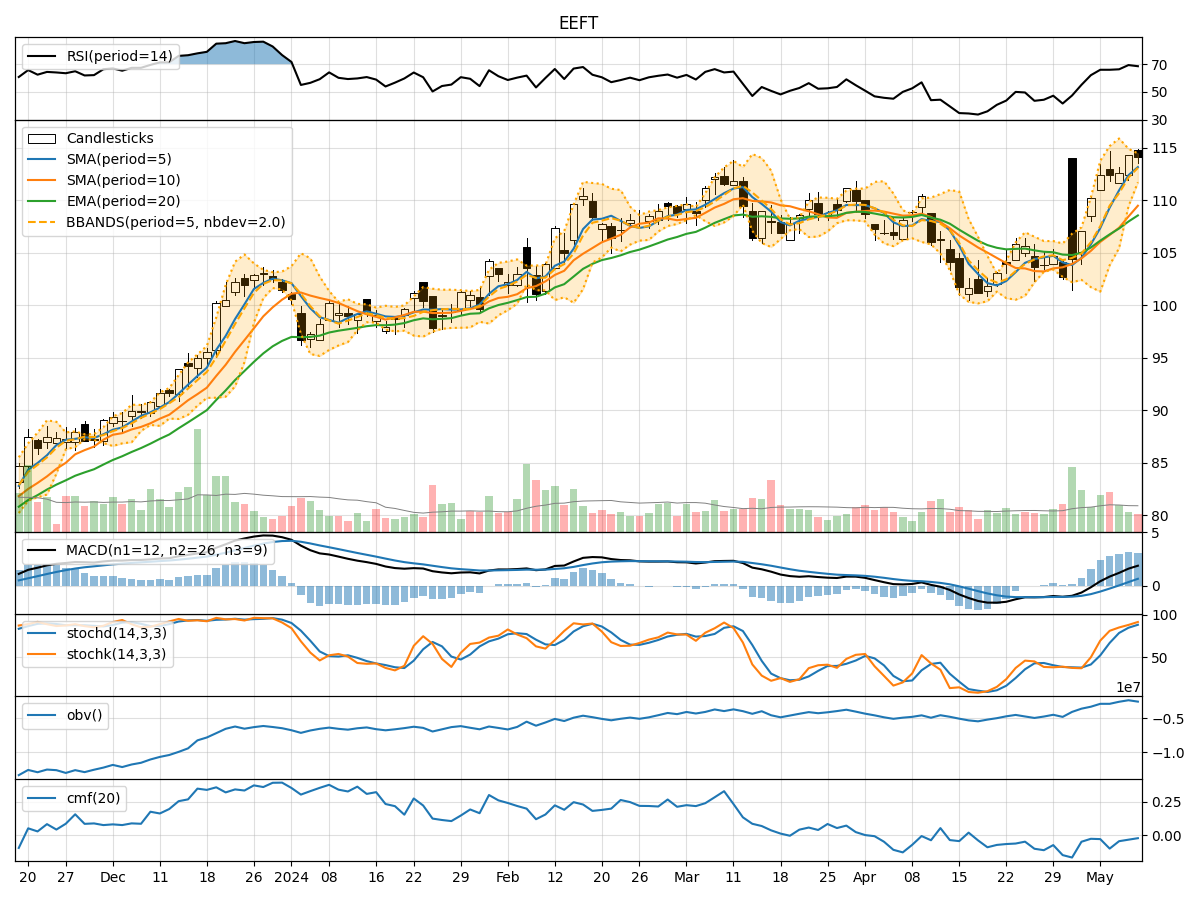
In analyzing the technical indicators for EEFT over the last 5 days, we will delve into the trend, momentum, volatility, and volume indicators to provide a comprehensive assessment of the stock's potential price movement. By examining these key factors, we aim to offer valuable insights and predictions for the next few days.
Trend Analysis:
- Moving Averages (MA): The 5-day Moving Average (MA) has been consistently above the Simple Moving Average (SMA) and Exponential Moving Average (EMA), indicating a bullish trend.
- MACD: The MACD line has been above the signal line, with the MACD histogram showing positive values, suggesting bullish momentum.
Momentum Analysis:
- RSI: The Relative Strength Index (RSI) has been in the overbought territory, indicating a strong bullish momentum.
- Stochastic Oscillator: Both %K and %D have been in the overbought zone, signaling a potential reversal or consolidation.
Volatility Analysis:
- Bollinger Bands (BB): The stock price has been trading within the upper Bollinger Band, suggesting an overbought condition.
Volume Analysis:
- On-Balance Volume (OBV): The OBV has shown mixed signals, indicating some divergence in volume and price movement.
- Chaikin Money Flow (CMF): The CMF has been negative, reflecting selling pressure in the stock.
Key Observations:
- The trend indicators suggest a strong bullish sentiment in the stock.
- Momentum indicators indicate a potential overbought condition, signaling a need for caution.
- Volatility indicators point towards a high level of price fluctuation.
- Volume indicators show mixed signals, with some divergence between volume and price movement.
Conclusion:
Based on the analysis of the technical indicators, the next few days' possible stock price movement for EEFT is likely to be sideways to slightly bearish. While the trend remains bullish, the overbought signals from momentum indicators and high volatility levels suggest a potential pullback or consolidation in the near term. Traders should exercise caution and consider taking profits or implementing risk management strategies in anticipation of a possible correction.