Technical Analysis of EJH 2024-05-10
Overview:
In analyzing the technical indicators for EJH stock over the last 5 days, we will delve into the trend, momentum, volatility, and volume indicators to provide a comprehensive outlook on the possible stock price movement in the coming days. By examining these key indicators, we aim to offer valuable insights and recommendations for potential investors.
Trend Analysis:
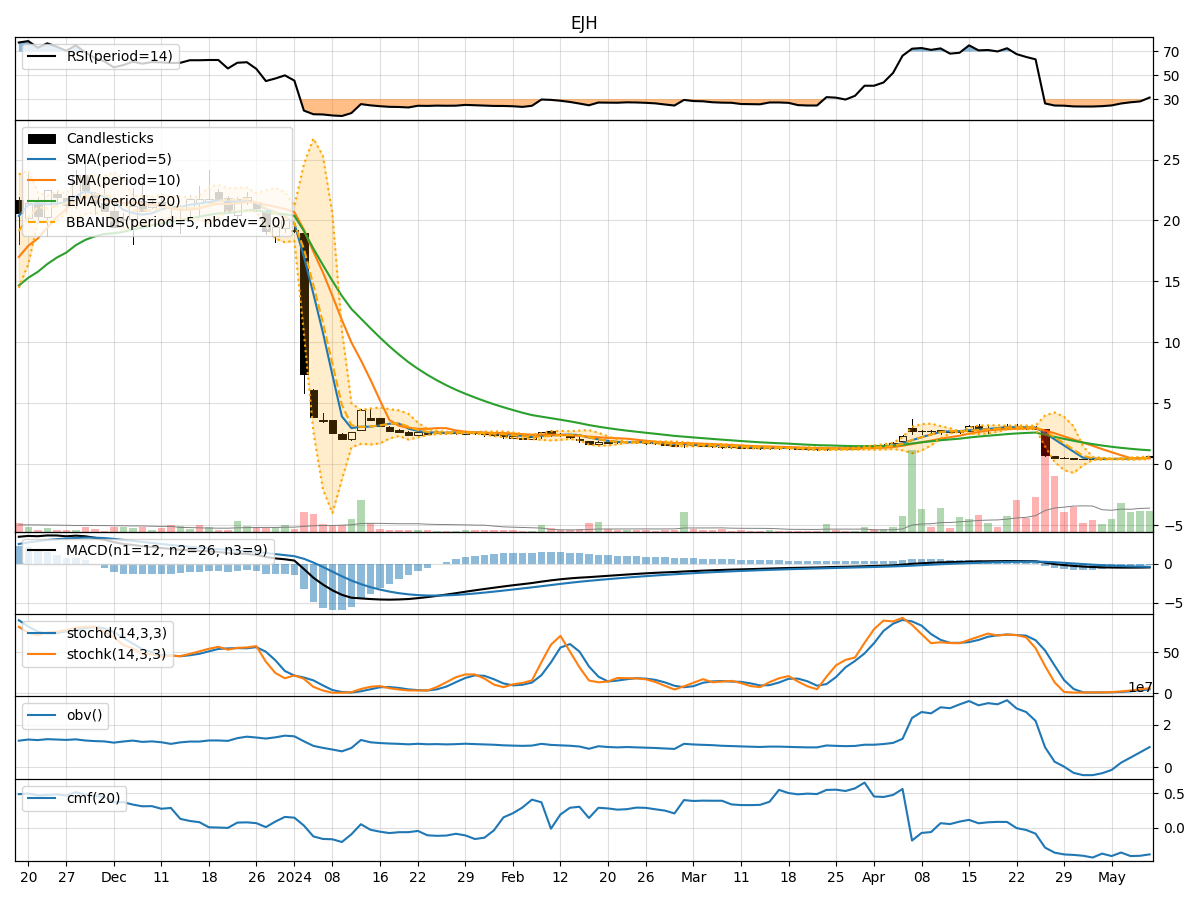
- Moving Averages (MA): The 5-day MA has been consistently increasing, indicating a bullish trend in the short term.
- MACD: The MACD line has been negative but showing signs of convergence towards the signal line, suggesting a potential reversal in the downtrend.
- EMA: The EMA has been declining, reflecting a bearish sentiment in the longer term.
Momentum Analysis:
- RSI: The RSI has been gradually increasing, indicating strengthening momentum.
- Stochastic Oscillator: Both %K and %D have been rising, suggesting increasing buying pressure.
- Williams %R: The indicator has been improving but remains in oversold territory, signaling a potential reversal.
Volatility Analysis:
- Bollinger Bands (BB): The bands have been widening, indicating increased price volatility.
- BB %B: The %B has been fluctuating within the bands, reflecting uncertainty in price direction.
Volume Analysis:
- On-Balance Volume (OBV): The OBV has been declining, suggesting distribution by investors.
- Chaikin Money Flow (CMF): The CMF has been negative, indicating outflow of money from the stock.
Key Observations:
- The trend indicators show a mixed picture with short-term bullish signals but long-term bearish sentiment.
- Momentum indicators suggest a potential reversal in the downtrend with increasing buying pressure.
- Volatility has been on the rise, indicating uncertainty and potential price swings.
- Volume indicators point towards distribution and negative money flow.
Conclusion:
Based on the analysis of the technical indicators, the next few days' possible stock price movement for EJH is likely to be volatile with a potential bullish reversal in the short term. Investors should closely monitor the momentum indicators for confirmation of the reversal and consider the increasing volatility in their trading strategies. However, the long-term trend remains bearish, so caution is advised for long-term positions.