Technical Analysis of ELBM 2024-05-10
Overview:
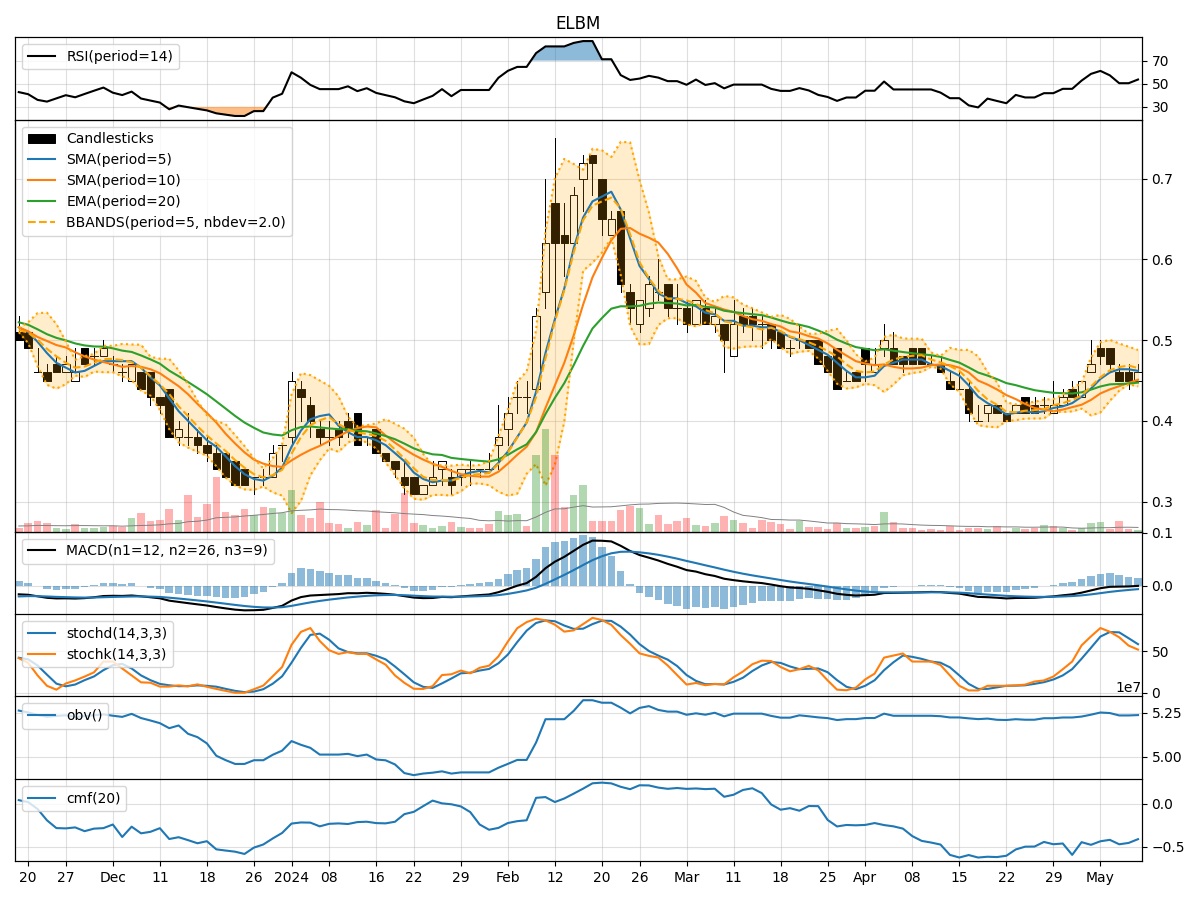
In the last 5 trading days, ELBM stock has shown mixed signals across various technical indicators. The stock price has fluctuated within a narrow range, indicating indecision in the market. We will analyze the trend, momentum, volatility, and volume indicators to determine the possible future movement of ELBM stock.
Trend Indicators:
- Moving Averages (MA): The 5-day MA has been fluctuating around the 10-day SMA and 20-day EMA, indicating a lack of clear trend direction.
- MACD: The MACD line has been consistently below the signal line, suggesting a bearish momentum in the short term.
- Conclusion: The trend indicators show a sideways movement with a slight bearish bias.
Momentum Indicators:
- RSI: The RSI has been oscillating around the 50 level, indicating a lack of strong momentum in either direction.
- Stochastic Oscillator: Both %K and %D have been declining, suggesting weakening buying pressure.
- Conclusion: The momentum indicators reflect a neutral stance with a slight bearish bias.
Volatility Indicators:
- Bollinger Bands (BB): The stock price has been trading within the bands, indicating a stable price range.
- Conclusion: Volatility indicators suggest a low volatility environment with the price likely to continue trading within the current range.
Volume Indicators:
- On-Balance Volume (OBV): The OBV has been relatively flat, indicating a balance between buying and selling pressure.
- Chaikin Money Flow (CMF): The CMF has been negative, suggesting outflow of money from the stock.
- Conclusion: Volume indicators point towards neutral volume activity with a slight bearish bias.
Overall Conclusion:
Based on the analysis of the technical indicators, the next few days for ELBM stock are likely to see sideways movement with a slight bearish bias. The lack of strong trend direction, coupled with neutral momentum and volume signals, indicates a period of consolidation. Traders may expect the stock price to continue trading within the current range with a potential downside bias. It is advisable to closely monitor key support and resistance levels for any potential breakout or reversal signals.
Key Recommendations:
- Monitor Support and Resistance Levels: Keep a close eye on key support and resistance levels to identify potential breakout opportunities.
- Risk Management: Implement proper risk management strategies to protect against unexpected price movements.
- Wait for Confirmation: Wait for clear confirmation signals from technical indicators before making any significant trading decisions.
- Consider Fundamental Factors: Additionally, consider any upcoming news or events that could impact the stock price.
Disclaimer:
Remember that technical analysis is not a guaranteed predictor of future price movements. It is essential to consider multiple factors and conduct thorough research before making any trading decisions. Consulting with a financial advisor or conducting further analysis using advanced tools like the pandas_ta module can provide additional insights tailored to your specific trading strategy and risk tolerance level.