Technical Analysis of ELTK 2024-05-10
Overview:
In analyzing the technical indicators for ELTK over the last 5 days, we will delve into the trend, momentum, volatility, and volume indicators to provide a comprehensive outlook on the possible stock price movement. By examining these key indicators, we aim to offer valuable insights and recommendations for potential future price action.
Trend Analysis:
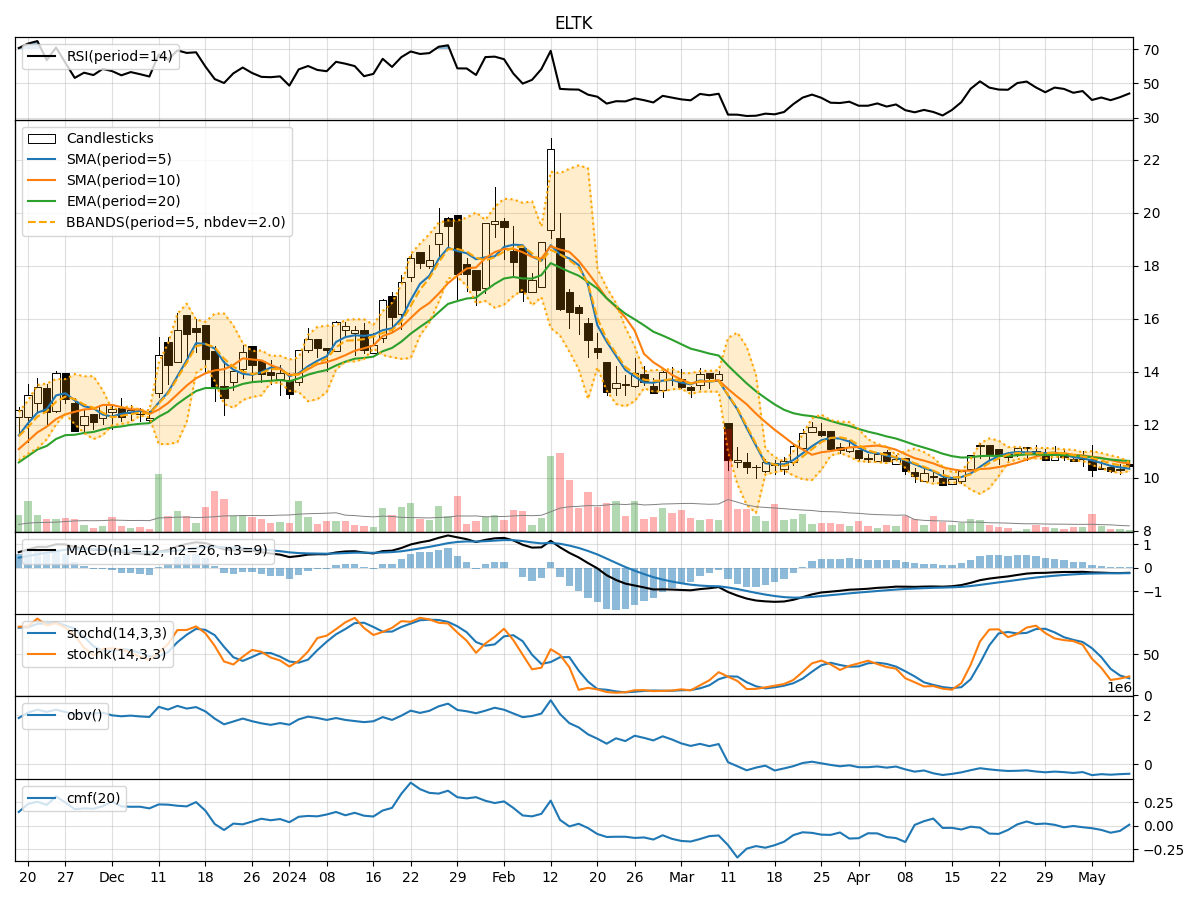
- Moving Averages (MA): The 5-day Moving Average (MA) has been consistently below the closing prices, indicating a short-term downtrend.
- MACD: The Moving Average Convergence Divergence (MACD) has been negative, suggesting bearish momentum in the stock.
- RSI: The Relative Strength Index (RSI) has been below 50, reflecting a lack of strong buying momentum.
Key Observation: The trend indicators point towards a bearish sentiment in the short term.
Momentum Analysis:
- Stochastic Oscillator: Both %K and %D have been below 20, indicating oversold conditions.
- Williams %R: The Williams %R has been consistently below -80, signaling an oversold market.
Key Observation: Momentum indicators suggest that the stock is currently oversold and may see a potential reversal.
Volatility Analysis:
- Bollinger Bands (BB): The stock price has been trading below the lower Bollinger Band, indicating oversold conditions.
- Bollinger %B: The Bollinger %B has been above 0.8, suggesting a potential bounce back from oversold levels.
Key Observation: Volatility indicators imply that the stock may be due for a reversal or a period of consolidation.
Volume Analysis:
- On-Balance Volume (OBV): The OBV has been declining, indicating selling pressure in the stock.
- Chaikin Money Flow (CMF): The CMF has been negative, reflecting a lack of buying interest.
Key Observation: Volume indicators support the bearish sentiment in the stock, with selling pressure dominating.
Conclusion:
Based on the analysis of the technical indicators, the next few days' possible stock price movement for ELTK is likely to see a short-term bounce back or consolidation after the recent oversold conditions. While the trend indicators suggest a bearish sentiment, the momentum and volatility indicators hint at a potential reversal or period of consolidation. However, the volume indicators continue to reflect selling pressure in the stock.
Overall, the stock may experience a short-term rebound or sideways movement before a clearer trend direction emerges. Traders should closely monitor key support and resistance levels for potential entry or exit points.
Key Conclusion:
- Short-term outlook: Potential bounce back or consolidation.
- Trend: Bearish in the short term.
- Momentum: Oversold conditions hint at a possible reversal.
- Volatility: Indicates a potential bounce back or consolidation.
- Volume: Reflects ongoing selling pressure.
Recommendation: Exercise caution and consider waiting for confirmation of a trend reversal before making significant trading decisions.