Technical Analysis of ELVA 2024-05-10
Overview:
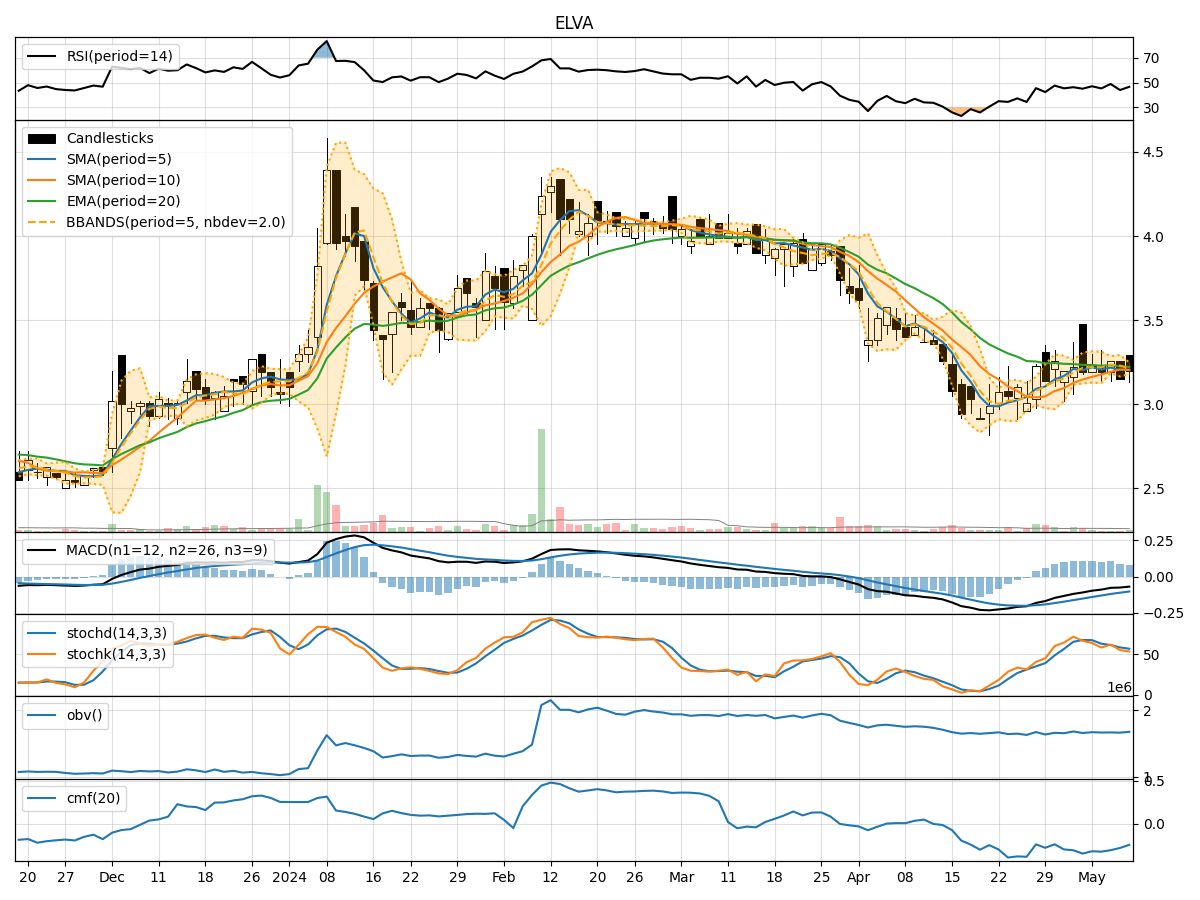
In analyzing the technical indicators for ELVA stock over the last 5 days, we will delve into the trend, momentum, volatility, and volume indicators to provide a comprehensive outlook on the possible future stock price movement. By examining these key indicators, we aim to offer valuable insights and predictions for the upcoming trading days.
Trend Analysis:
- Moving Averages (MA): The 5-day Moving Average (MA) has been fluctuating around the current stock price, indicating a lack of clear trend direction.
- MACD: The Moving Average Convergence Divergence (MACD) has been consistently negative, suggesting a bearish momentum in the short term.
- EMA: The Exponential Moving Average (EMA) has been slightly declining, reflecting a weakening trend.
Key Observation: The trend indicators point towards a bearish sentiment in the short term.
Momentum Analysis:
- RSI: The Relative Strength Index (RSI) has been hovering around the 50 level, indicating a neutral momentum.
- Stochastic Oscillator: Both %K and %D have been in the oversold territory, signaling a potential reversal in momentum.
- Williams %R: The Williams %R is also in the oversold region, suggesting a possible bounce back.
Key Observation: The momentum indicators suggest a potential reversal in the current bearish momentum.
Volatility Analysis:
- Bollinger Bands: The Bollinger Bands have been narrowing, indicating decreasing volatility in the stock price.
- Bollinger %B: The %B indicator has been fluctuating within a tight range, reflecting a lack of significant price movement.
Key Observation: Volatility is decreasing, suggesting a potential period of consolidation or sideways movement.
Volume Analysis:
- On-Balance Volume (OBV): The OBV has been relatively stable, showing no significant divergence from the price movement.
- Chaikin Money Flow (CMF): The CMF has been negative, indicating selling pressure in the stock.
Key Observation: The volume indicators do not provide a clear direction, but the negative CMF suggests a bearish sentiment.
Conclusion:
Based on the analysis of the technical indicators, the next few days for ELVA stock are likely to see a continuation of the bearish trend in the short term. However, the momentum indicators hint at a potential reversal in the current downward momentum. The decreasing volatility suggests a period of consolidation or sideways movement, while the volume indicators point towards a bearish sentiment in the market.
Recommendation:
- Short-term Traders: Consider short positions or staying on the sidelines until a clearer trend emerges.
- Long-term Investors: Monitor the price action closely for potential entry points or wait for a more stable trend to develop.
Disclaimer:
This analysis is based solely on technical indicators and historical data, and it is essential to consider other fundamental factors before making any investment decisions. Market dynamics can change rapidly, so it is crucial to stay informed and adapt to new information as it becomes available.