Technical Analysis of ERII 2024-05-31
Overview:
In analyzing the technical indicators for ERII over the last 5 days, we will delve into the trends, momentum, volatility, and volume indicators to provide a comprehensive outlook on the possible stock price movement. By examining these key factors, we aim to offer valuable insights and predictions for the upcoming days.
Trend Analysis:
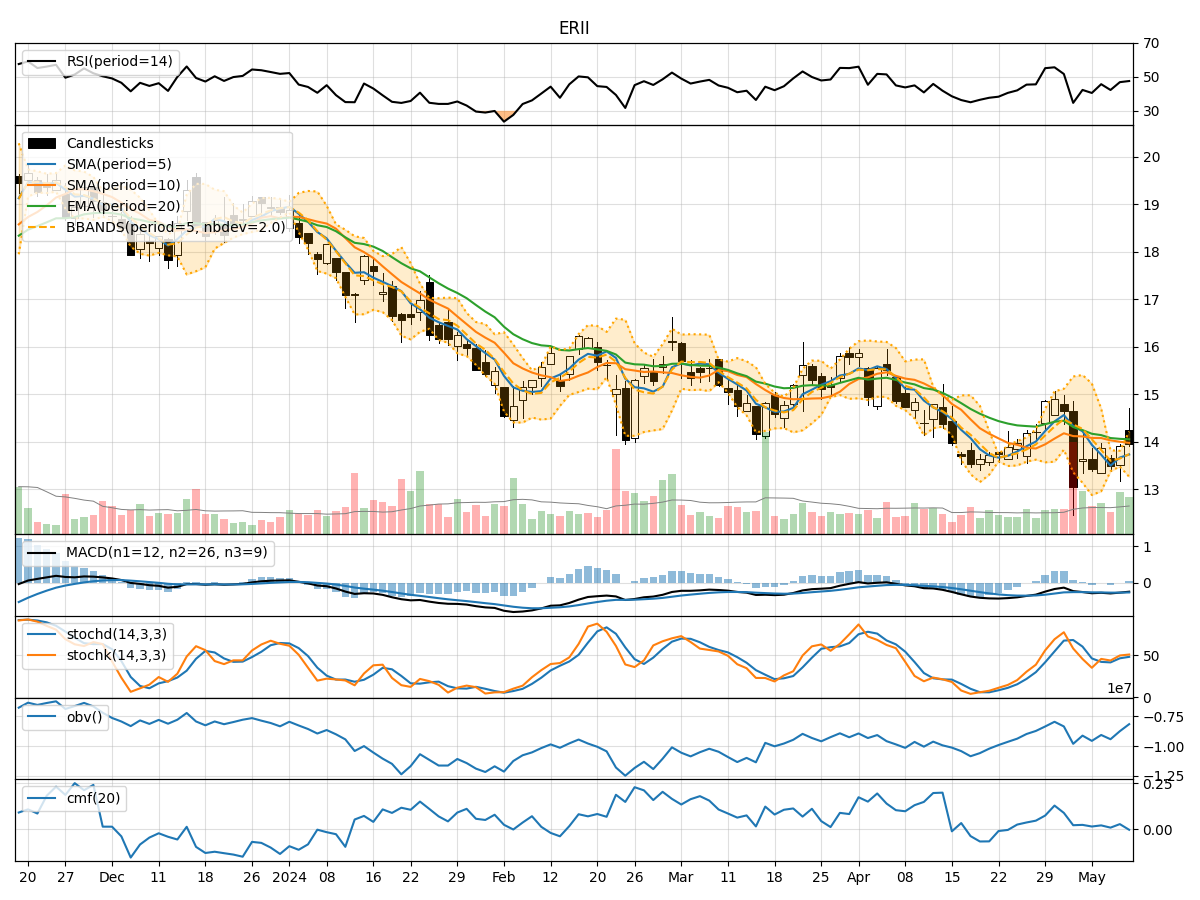
- Moving Averages (MA): The 5-day MA has been fluctuating around the closing prices, indicating a lack of clear trend direction.
- MACD: The MACD line has been consistently below the signal line, suggesting a bearish momentum in the short term.
- RSI: The RSI values have been hovering around the mid-range, reflecting a neutral sentiment in terms of momentum.
Momentum Analysis:
- Stochastic Oscillator: Both %K and %D values have been declining, indicating a potential bearish momentum.
- Williams %R: The Williams %R values have been fluctuating in the oversold territory, signaling a possible reversal in the short term.
Volatility Analysis:
- Bollinger Bands (BB): The stock price has been trading within the bands, with the %B indicator showing fluctuations but not indicating any extreme conditions.
- Average True Range (ATR): The ATR values have been relatively stable, suggesting consistent price movements without significant spikes.
Volume Analysis:
- On-Balance Volume (OBV): The OBV values have been fluctuating, indicating mixed buying and selling pressure.
- Chaikin Money Flow (CMF): The CMF values have been negative, suggesting a net outflow of money from the stock.
Key Observations:
- The trend indicators show a lack of clear direction, with the MACD signaling a bearish bias.
- Momentum indicators point towards a potential bearish momentum in the short term.
- Volatility remains relatively stable, with no extreme movements detected.
- Volume indicators reflect mixed buying and selling pressure, with a slight net outflow of money.
Conclusion:
Based on the analysis of the technical indicators, the outlook for ERII in the next few days leans towards a bearish sentiment. The trend indicators, coupled with the momentum signals, suggest a potential downward movement in the stock price. Traders and investors should exercise caution and consider implementing risk management strategies in anticipation of a possible downward trend.