Technical Analysis of EUDA 2024-05-10
Overview:
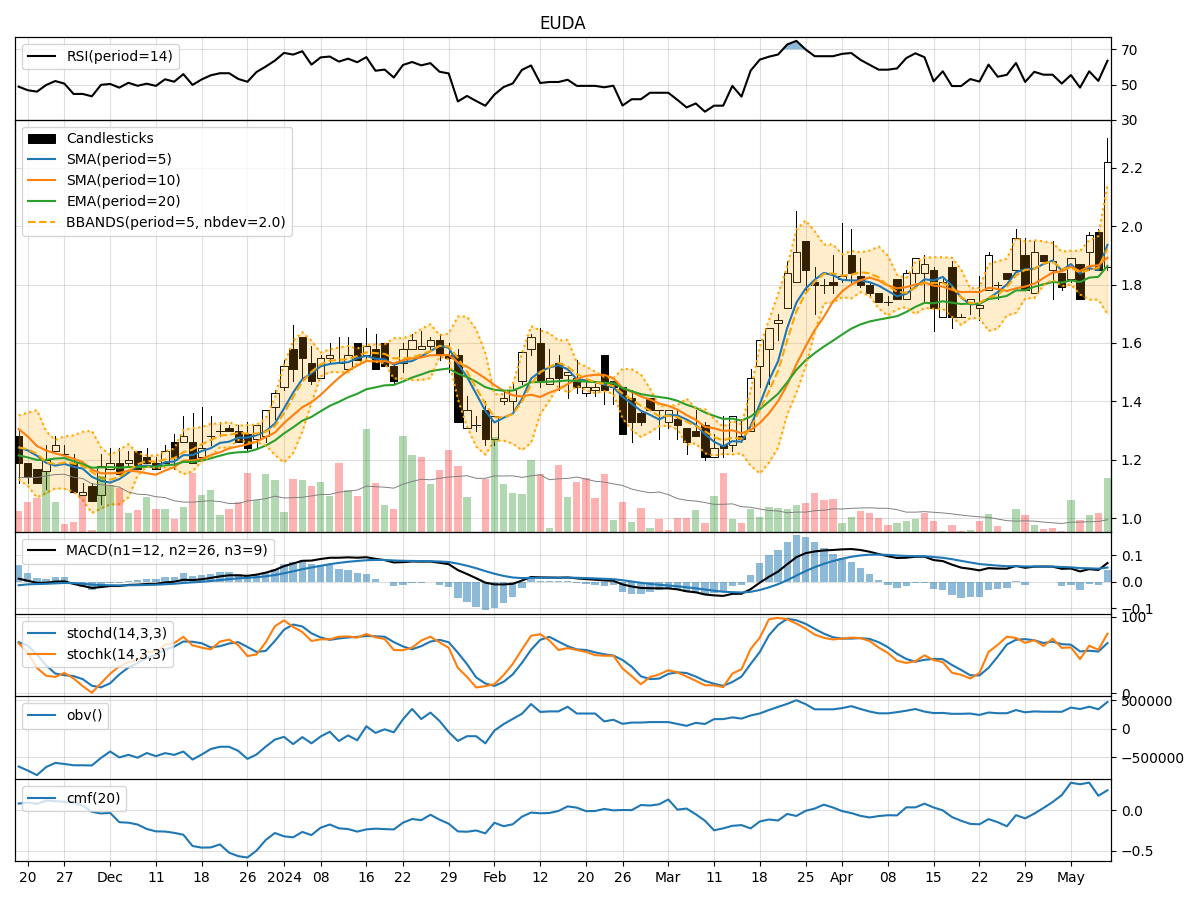
In analyzing the technical indicators for EUDA stock over the last 5 days, we will delve into the trends, momentum, volatility, and volume aspects to provide a comprehensive outlook on the possible stock price movement in the coming days. By examining key indicators such as moving averages, MACD, RSI, Stochastic Oscillator, Bollinger Bands, and OBV, we aim to offer valuable insights and predictions for informed decision-making.
Trend Analysis:
- Moving Averages (MA): The 5-day moving average has been fluctuating around the closing prices, indicating short-term price trends.
- MACD: The MACD line has been positive, suggesting bullish momentum in the stock.
- EMA: The exponential moving average has been trending upwards, reflecting a positive price trend.
Momentum Analysis:
- RSI: The Relative Strength Index has shown fluctuations but generally remains in the neutral zone, indicating a balanced momentum.
- Stochastic Oscillator: Both %K and %D have been moving in the overbought region, signaling potential for a pullback.
- Williams %R: The Williams %R has been volatile but currently indicates a slightly oversold condition.
Volatility Analysis:
- Bollinger Bands: The stock price has been trading within the bands, suggesting moderate volatility.
- Bollinger %B: The %B indicator has been fluctuating around the midline, indicating a balanced volatility level.
Volume Analysis:
- On-Balance Volume (OBV): The OBV has shown mixed movements, reflecting indecision among investors.
- Chaikin Money Flow (CMF): The CMF has been positive but relatively low, indicating some buying pressure.
Key Observations:
- The stock has shown signs of bullish momentum based on the MACD and EMA trends.
- The RSI and Stochastic Oscillator suggest a mixed sentiment with potential for a pullback.
- Volatility has been moderate, as indicated by the Bollinger Bands.
- Volume indicators show a lack of strong conviction among investors.
Conclusion:
Based on the analysis of the technical indicators, the stock price is likely to experience a period of consolidation in the near term. While there are indications of bullish momentum, the mixed signals from momentum and volume indicators suggest a lack of strong directional bias. Traders should exercise caution and wait for clearer signals before taking significant positions.